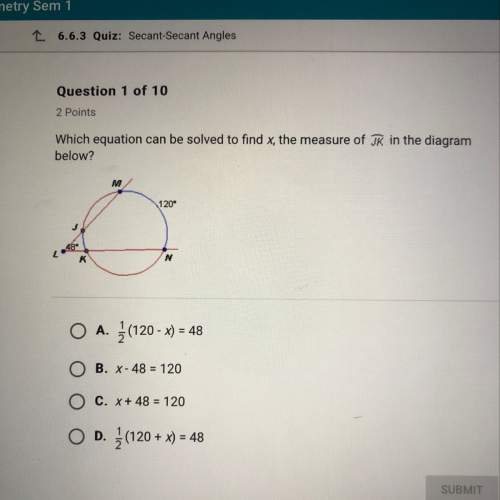
What function is shown in the graph?
A) y = -7x
B) y = 7-x
C) y = 7x – 3
...

Mathematics, 11.02.2020 00:15 9826zed
What function is shown in the graph?
A) y = -7x
B) y = 7-x
C) y = 7x – 3
D) y = 7x – 3

Answers: 3


Other questions on the subject: Mathematics


Mathematics, 22.06.2019 01:00, cldantesBanana
What is the y-intercept of the line with the equation 3x + 4y = 12?
Answers: 1

Mathematics, 22.06.2019 02:00, nakarelinp0p303
Which of the following transformations will make coincide with ? a. counter-clockwise rotation 90º about a, followed by a translation 5 units to the right b. translation 5 units to the right, followed by a reflection across the y-axis c. translation 5 units to the right, followed by a reflection across the x-axis d. translation 1 unit up and 5 units to the right, followed by a reflection across the x-axis
Answers: 3

Mathematics, 22.06.2019 04:30, glocurlsprinces
Consider the linear model for a two-stage nested design with b nested in a as given below. yijk=\small \mu + \small \taui + \small \betaj(i) + \small \varepsilon(ij)k , for i=1,; j= ; k=1, assumption: \small \varepsilon(ij)k ~ iid n (0, \small \sigma2) ; \small \taui ~ iid n(0, \small \sigmat2 ); \tiny \sum_{j=1}^{b} \small \betaj(i) =0; \small \varepsilon(ij)k and \small \taui are independent. using only the given information, derive the least square estimator of \small \betaj(i) using the appropriate constraints (sum to zero constraints) and derive e(msb(a) ).
Answers: 2
You know the right answer?
Questions in other subjects:


Mathematics, 19.07.2019 16:00


Mathematics, 19.07.2019 16:00

Mathematics, 19.07.2019 16:00

World Languages, 19.07.2019 16:00

Mathematics, 19.07.2019 16:00

World Languages, 19.07.2019 16:00


