
Mathematics, 08.02.2020 14:40 bjbass899
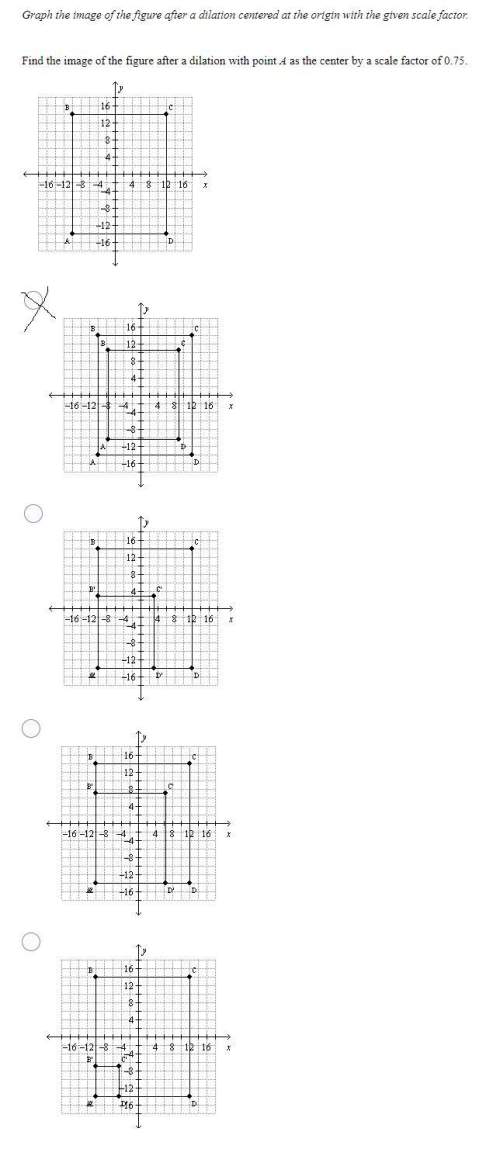
1. graph the image of the figure after a dilation centered at the origin with the given scale factor.
find the image of the figure after a dilation with point a as the center by a scale factor of 0.75.

Answers: 3


Other questions on the subject: Mathematics
Mathematics, 21.06.2019 18:30, bellabarfield4286
The u-drive rent-a-truck company plans to spend $13 million on 320 new vehicles. each commercial van will cost $25 comma 000, each small truck $50 comma 000, and each large truck $80 comma 000. past experience shows that they need twice as many vans as small trucks. how many of each type of vehicle can they buy?
Answers: 1
Mathematics, 21.06.2019 23:00, kj44
Each of the following data sets has a mean of x = 10. (i) 8 9 10 11 12 (ii) 7 9 10 11 13 (iii) 7 8 10 12 13 (a) without doing any computations, order the data sets according to increasing value of standard deviations. (i), (iii), (ii) (ii), (i), (iii) (iii), (i), (ii) (iii), (ii), (i) (i), (ii), (iii) (ii), (iii), (i) (b) why do you expect the difference in standard deviations between data sets (i) and (ii) to be greater than the difference in standard deviations between data sets (ii) and (iii)? hint: consider how much the data in the respective sets differ from the mean. the data change between data sets (i) and (ii) increased the squared difference îł(x - x)2 by more than data sets (ii) and (iii). the data change between data sets (ii) and (iii) increased the squared difference îł(x - x)2 by more than data sets (i) and (ii). the data change between data sets (i) and (ii) decreased the squared difference îł(x - x)2 by more than data sets (ii) and (iii). none of the above
Answers: 2
Mathematics, 21.06.2019 23:40, supermimi8078
The bolo cavern outside of vandalia is 421 ft below sea level. a little more than75 miles away. mt owens is 7295 feet above sea level. what is the difference in elevation between the bolo cavern and mt owens?
Answers: 1
Mathematics, 22.06.2019 01:30, zitterkoph
The box plots show the distributions of the numbers of words per line in an essay printed in two different fonts.which measure of center would be best to compare the data sets? the median is the best measure because both distributions are left-skewed.the mean is the best measure because both distributions are left-skewed.the median is the best measure because both distributions are symmetric.the mean is the best measure because both distributions are symmetric
Answers: 1
You know the right answer?
1. graph the image of the figure after a dilation centered at the origin with the given scale factor...
Questions in other subjects:


Mathematics, 10.03.2021 14:00
Mathematics, 10.03.2021 14:00
Chemistry, 10.03.2021 14:00
Computers and Technology, 10.03.2021 14:00


