
Mathematics, 05.02.2020 21:42 quissowavyquis8484
Following are measurements of soil concentrations (in mg/kg) of chromium (cr) and nickel (ni) at 20 sites in the area of cleveland, ohio. these data are taken from the article "variation in north american regulatory guidance for heavy metal surface soil contamination at commercial and industrial sites" (a. jennings and j. ma, j environment eng, 2007: 587–609).
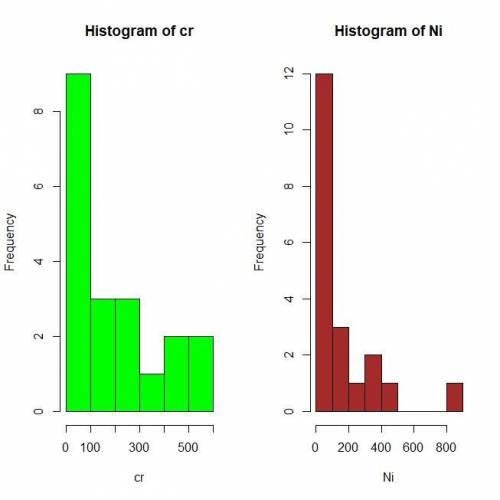
cr: 34 1 511 2 574 496 322 424 269 140 244 252 76 108 24 38 18 34 3o 191
ni: 23 22 55 39 283 34 159 37 61 34 163 140 32 23 54 837 64 354 376 471
(a) construct a histogram for each set of concentrations.
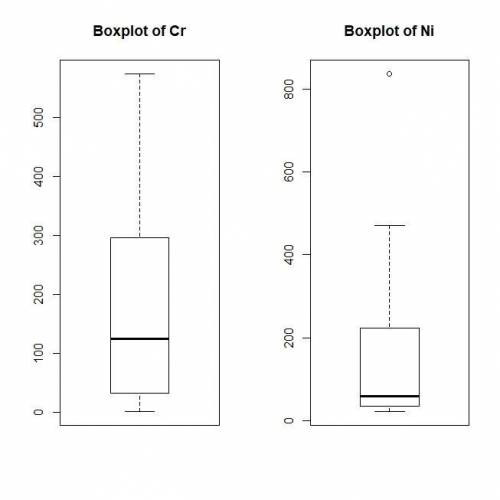
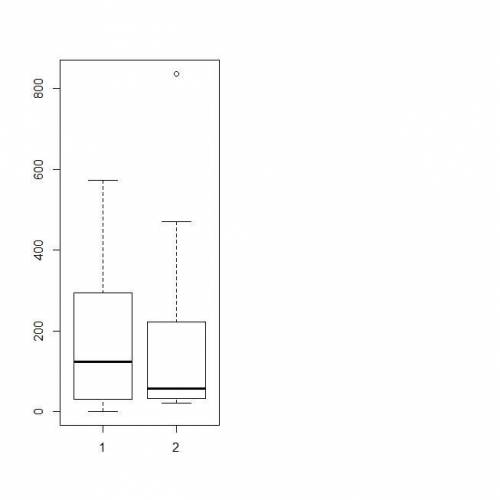
(b) construct comparative boxplots for the two sets of concentrations.
(c) using the boxplots, what differences can be seen between the two sets of concentrations?

Answers: 2


Other questions on the subject: Mathematics
Mathematics, 21.06.2019 18:00, emmanuelcampbel
Jack has a piece of red ribbon that is two times as long as his piece of blue ribbon. he says that he can use two different equation to find out how long his piece of red ribbon is compared to his piece of blue ribbon is. is he correct? explain his reasoning
Answers: 1
Mathematics, 21.06.2019 22:00, connorhanratty6487
James is playing his favorite game at the arcade. after playing the game 33 times, he has 88 tokens remaining. he initially had 2020 tokens, and the game costs the same number of tokens each time. the number tt of tokens james has is a function of gg, the number of games he plays
Answers: 1
Mathematics, 22.06.2019 00:30, cortneyka10
Tim tradesman pays $2,000 annually for $125,000 worth of life insurance. what is the cash value of the policy after 10 years? 11,125 13,125 17,800 111,250
Answers: 2
Mathematics, 22.06.2019 01:20, blackboy21
1. why is a frequency distribution useful? it allows researchers to see the "shape" of the data. it tells researchers how often the mean occurs in a set of data. it can visually identify the mean. it ignores outliers. 2. the is defined by its mean and standard deviation alone. normal distribution frequency distribution median distribution marginal distribution 3. approximately % of the data in a given sample falls within three standard deviations of the mean if it is normally distributed. 95 68 34 99 4. a data set is said to be if the mean of the data is greater than the median of the data. normally distributed frequency distributed right-skewed left-skewed
Answers: 2
You know the right answer?
Following are measurements of soil concentrations (in mg/kg) of chromium (cr) and nickel (ni) at 20...
Questions in other subjects:
Mathematics, 15.04.2021 23:20

Mathematics, 15.04.2021 23:20

Spanish, 15.04.2021 23:20


English, 15.04.2021 23:20


