
Mathematics, 27.01.2020 12:31 MsTasha06
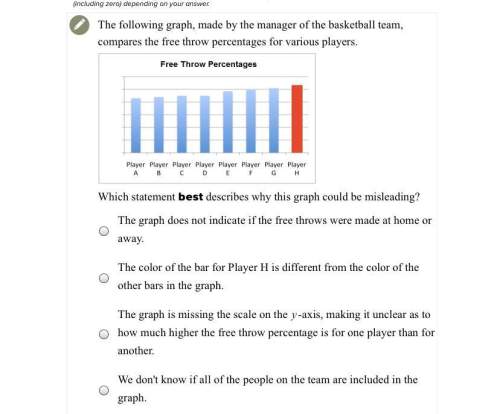
The following graph, made by the manager of the basketball team, compares the free throw percentages for various players.
which statement best describes why this graph could be misleading?
a. the graph does not indicate if the free throws were made at home or away.
b. the color of the bar for player h is different from the color of the other bars in the graph.
c. the graph is missing the scale on the y-axis, making it unclear as to how much higher the free throw percentage is for one player than for another.
d. we don't know if all of the people on the team are included in the graph.

Answers: 1


Other questions on the subject: Mathematics
Mathematics, 21.06.2019 22:30, iyanistacks50
Acredit union pays 5% annual interest, compounded daily, on savings deposits. find the value after one year of $500 deposited in this account. $525.64 $25.64 $20.40 $520.40
Answers: 2
Mathematics, 22.06.2019 00:00, kaylagoof4140
Which expression is a perfect cube? a. x8 b. y24 c. m28 d. x64
Answers: 3
Mathematics, 22.06.2019 04:00, cbbentonam72
Xf(x) = 2x + 5 1 7 2 9 3 11 4 13 5 15 6 17 linear functions grow by equal differences over equal intervals. in the table above, what column could be added to prove this relationship?
Answers: 1
You know the right answer?
The following graph, made by the manager of the basketball team, compares the free throw percentages...
Questions in other subjects:
Mathematics, 26.01.2020 15:31

History, 26.01.2020 15:31

Geography, 26.01.2020 15:31
Mathematics, 26.01.2020 15:31

Biology, 26.01.2020 15:31
History, 26.01.2020 15:31


