Mathematics, 26.01.2020 07:31 zozo72
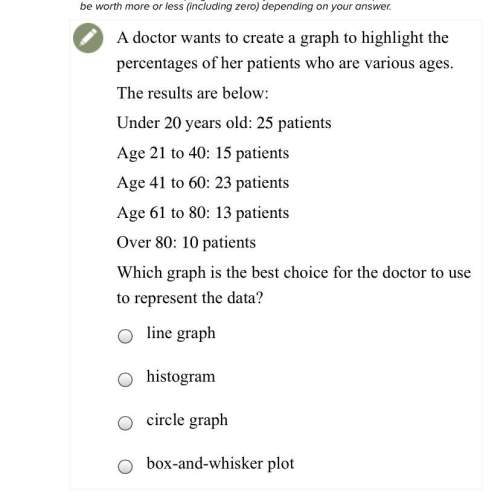
Adoctor wants to create a graph to highlight the percentages of her patients who are various ages.
the results are below:
under 20years old: 25patients
age 21 to 40: 15patients
age 41 to 60: 23patients
age 61 to 80: 13patients
over 80: 10 patients
which graph is the best choice for the doctor to use to represent the data?
a. line graph
b. histogram
c. circle graph
d. box-and-whisker plot


Answers: 2


Other questions on the subject: Mathematics

Mathematics, 21.06.2019 13:30, janeliles
Lassify the function as linear or quadratic and identify the quadratic, linear, and constant terms. f(x) = (3x + 2)(−6x − 3) linear function; linear term: −21x; constant term: −6 linear function; linear term: −18x2; constant term: −6 quadratic function; quadratic term: 6x2; linear term: 24x; constant term: −6 quadratic function; quadratic term: −18x2; linear term: −21x; constant term: −6
Answers: 3


You know the right answer?
Adoctor wants to create a graph to highlight the percentages of her patients who are various ages.
Questions in other subjects:


Social Studies, 22.02.2021 20:50


Mathematics, 22.02.2021 20:50


Mathematics, 22.02.2021 20:50

History, 22.02.2021 20:50


