
Mathematics, 25.01.2020 00:31 chiquita77
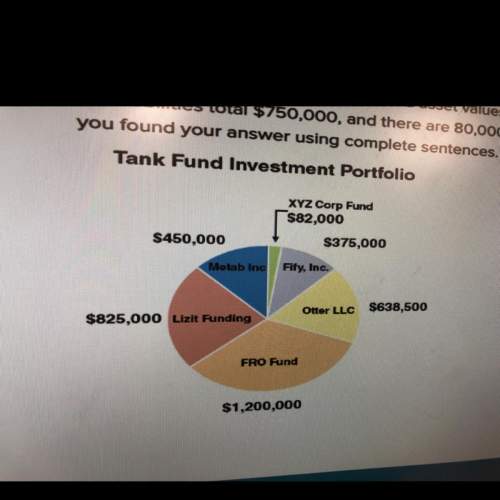
The graph reflects the breakdown and asset values for the six investment securities within the tank investment fund.
the liabilities total $750,000, and there are 80,000 outstanding shares. calculate the nav and navps. explain how
you found your answer using complete sentences.

Answers: 1


Other questions on the subject: Mathematics
Mathematics, 21.06.2019 12:30, raiderries
For the following sequence determine the common difference (if it is an arithmetic sequence) or the common ratio (if it is a geometric sequence).
Answers: 3
Mathematics, 21.06.2019 18:30, 987654321156
The volume of gas a balloon can hold varies directly as the cube of its radius. imagine a balloon with a radius of 3 inches can hold 81 cubic inches of gas. how many cubic inches of gas must be released to reduce the radius down to 2 inches?
Answers: 1
Mathematics, 21.06.2019 21:30, fheight01
Name and describe the three most important measures of central tendency. choose the correct answer below. a. the mean, sample size, and mode are the most important measures of central tendency. the mean of a data set is the sum of the observations divided by the middle value in its ordered list. the sample size of a data set is the number of observations. the mode of a data set is its highest value in its ordered list. b. the sample size, median, and mode are the most important measures of central tendency. the sample size of a data set is the difference between the highest value and lowest value in its ordered list. the median of a data set is its most frequently occurring value. the mode of a data set is sum of the observations divided by the number of observations. c. the mean, median, and mode are the most important measures of central tendency. the mean of a data set is the product of the observations divided by the number of observations. the median of a data set is the lowest value in its ordered list. the mode of a data set is its least frequently occurring value. d. the mean, median, and mode are the most important measures of central tendency. the mean of a data set is its arithmetic average. the median of a data set is the middle value in its ordered list. the mode of a data set is its most frequently occurring value.
Answers: 3
You know the right answer?
The graph reflects the breakdown and asset values for the six investment securities within the tank...
Questions in other subjects:

Physics, 17.07.2021 17:50


Mathematics, 17.07.2021 18:00
Mathematics, 17.07.2021 18:00


World Languages, 17.07.2021 18:00

Social Studies, 17.07.2021 18:00


