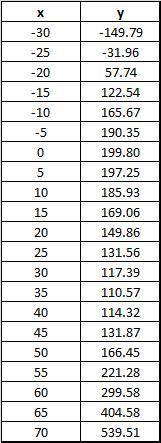
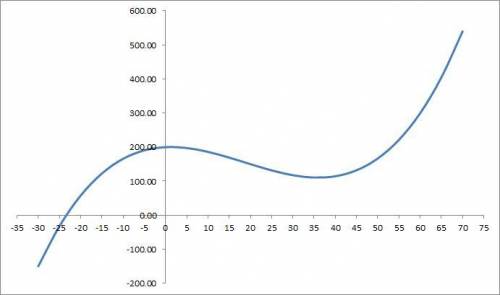
Y= 0.0043x3 − 0.24x2 + 0.583x + 199.8
what does this look like graphed ?...

Mathematics, 24.01.2020 08:31 vivian2020
Y= 0.0043x3 − 0.24x2 + 0.583x + 199.8
what does this look like graphed ?

Answers: 2


Other questions on the subject: Mathematics
Mathematics, 21.06.2019 18:30, mikey8510
The median of a data set is the measure of center that is found by adding the data values and dividing the total by the number of data values that is the value that occurs with the greatest frequency that is the value midway between the maximum and minimum values in the original data set that is the middle value when the original data values are arranged in order of increasing (or decreasing) magnitude
Answers: 3
Mathematics, 21.06.2019 23:00, ronniethefun
Edger needs 6 cookies and 2 brownies for every 4 plates how many cookies and brownies does he need for 10 plates
Answers: 1
You know the right answer?
Questions in other subjects:

Mathematics, 25.12.2019 06:31
Mathematics, 25.12.2019 06:31

Biology, 25.12.2019 06:31


French, 25.12.2019 06:31


