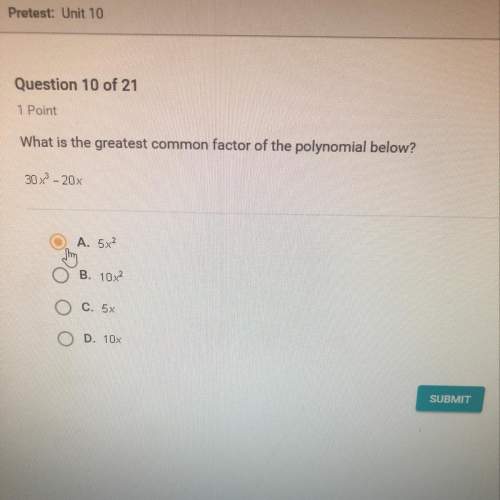
D. 10x is the correct answer a and c are the common factor of 30 and 20 but it’s not the greatestonly b and d are the answers since 30x^3 -20x20x only have one x and 30 have 3 xso it can only be d.10xhope this will !
What is the equation and solution for the sentence? the sum of a number and thirty-one is one hundred thirteen. write the equation as n-31=113 and subtract 31 from both sides. the answer is 82. write the equation as n+31=113 and subtract 31 from both sides. the answer is 82. write the equation as n+31=113 and add 31 to both sides. the answer is 144. write the equation as n-31=113 and add 31 to both sides. the answer is 144.
Let f(x) = 3 − x . find the average rate of change of f(x) from x = a to x = a + h and simplify your answer so that no single factor of h is left in the denominator.