
Mathematics, 22.01.2020 01:31 Graciesett6879
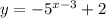
For the graphed function f(x) = −(5)x − 3 + 2, calculate the average rate of change from x = 3 to x = 4.
a graph of an exponential function that goes through the points 0 comma 2, 3 comma 1, and 4 comma negative 3
a. −4
b.4
c. 1
d.-1

Answers: 2


Other questions on the subject: Mathematics
Mathematics, 22.06.2019 03:00, 19mcgough
Harold wrote this equation to model the level of water in a pool over time. the variable x represents time in hours. f(x) = 3,500 - 225x which statements about the situation are true? check all that apply. the water level is rising. the water level is falling. the initial level of water in the pool was 3,500 units. the initial level of water in the pool was 225 units. the pool was empty after 14 hours. the water was 2,600 units high after 4 hours.
Answers: 2
You know the right answer?
For the graphed function f(x) = −(5)x − 3 + 2, calculate the average rate of change from x = 3 to x...
Questions in other subjects:

Chemistry, 26.03.2020 04:07


History, 26.03.2020 04:08
History, 26.03.2020 04:08
Mathematics, 26.03.2020 04:08


