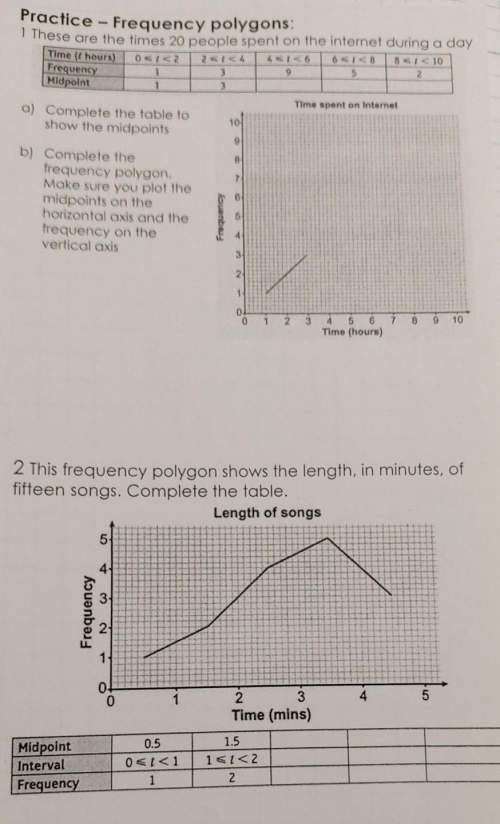
Where do i plot the points? and, what do i put in the tables?
...

Mathematics, 19.01.2020 23:31 amselah3571
Where do i plot the points? and, what do i put in the tables?

Answers: 2


Other questions on the subject: Mathematics
Mathematics, 21.06.2019 13:00, jay0630
The graph shows the prices of different numbers of bushels of corn at a store in the current year. the table shows the prices of different numbers of bushels of corn at the same store in the previous year. previous year number of bushels price of corn (dollars) 2 10 4 20 6 30 8 40 part a: describe in words how you can find the rate of change of a bushel of corn in the current year, and find the value. part b: how many dollars more is the price of a bushel of corn in the current year than the price of a bushel of corn in the previous year? show your work.
Answers: 1
Mathematics, 22.06.2019 04:20, itsmemichellel
What is the difference between a linear interval and a nonlinear interval?
Answers: 1
You know the right answer?
Questions in other subjects:


English, 29.04.2021 07:10
Mathematics, 29.04.2021 07:10
Chemistry, 29.04.2021 07:10
Mathematics, 29.04.2021 07:10
Mathematics, 29.04.2021 07:10


