
Mathematics, 18.01.2020 13:31 noathequeen
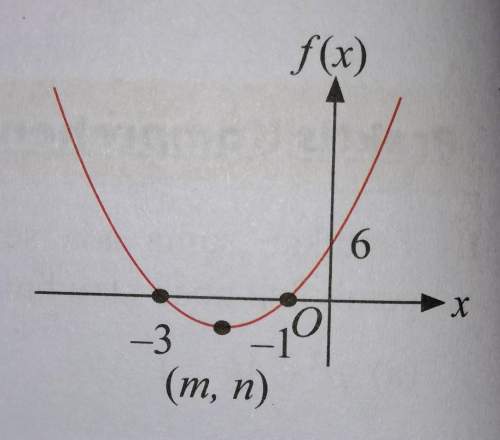
The diagram below shows the graph of the quadratic function f (x) = ax² + 8x + c. calculate the value for each of the following.
(a)c,
(b)m,
(c)a,
(d)n.

Answers: 1
 =
=  = - 2
= - 2

Other questions on the subject: Mathematics
Mathematics, 21.06.2019 16:30, macenzie26
What could explain what happened when the time was equal to 120 minutes
Answers: 2
Mathematics, 21.06.2019 18:30, 128585
Adoctor administers a drug to a 38-kg patient, using a dosage formula of 50 mg/kg/day. assume that the drug is available in a 100 mg per 5 ml suspension or in 500 mg tablets. a. how many tablets should a 38-kg patient take every four hours? b. the suspension with a drop factor of 10 ggt/ml delivers the drug intravenously to the patient over a twelve-hour period. what flow rate should be used in units of ggt/hr? a. the patient should take nothing pills every four hours. (type an integer or decimal rounded to the nearest hundredth as needed.)
Answers: 1
Mathematics, 21.06.2019 20:30, GreenHerbz206
Tom is the deli manager at a grocery store. he needs to schedule employee to staff the deli department for no more that 260 person-hours per week. tom has one part-time employee who works 20 person-hours per week. each full-time employee works 40 person-hours per week. write and inequality to determine n, the number of full-time employees tom may schedule, so that his employees work on more than 260 person-hours per week. graph the solution set to this inequality.
Answers: 1
You know the right answer?
The diagram below shows the graph of the quadratic function f (x) = ax² + 8x + c. calculate the valu...
Questions in other subjects:


History, 24.08.2020 08:01

English, 24.08.2020 08:01


Mathematics, 24.08.2020 08:01


