
Mathematics, 17.01.2020 04:31 ronaldotheexplorer12
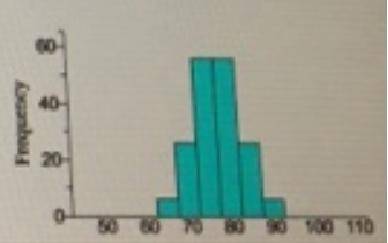
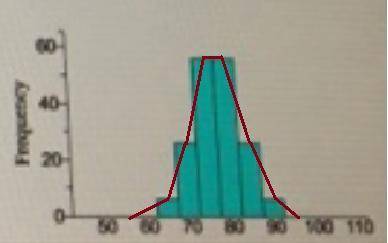
The histogram to the right them the times between eruptions of. geyser for a sample of 300 eruptions (which means 299 time between eruptions). over the histogram, draw a smooth curve that capture general feature then classify the distribution according to ka number of peaks sod symmetry or skewness. chose the correct answer below. a. one peak, symmetric, low variation b. three peaks, symmetric, wide variation c. one peak, right-skewed. moderate variation d. two peaks, left-slewed, wide variation

Answers: 2


Other questions on the subject: Mathematics
Mathematics, 21.06.2019 18:30, viktoria1198zz
Florence price's brownies and more sells all types of cookies and pastries. on tuesdays, they markdown all brownies 75% to a sale of $1.50 a dozen. find the selling price and the markdown of a dozen brownies.
Answers: 1
Mathematics, 21.06.2019 19:30, AriesTwice
Acollection of coins has value of 64 cents. there are two more nickels than dimes and three times as many pennies as dimes in this collection. how many of each kind of coin are in the collection?
Answers: 1
Mathematics, 21.06.2019 23:20, ajbrock1004
In a small section of a stadium there are 40 spectators watching a game between the cook islands and fiji. they all support at least one of the two teams. 25 spectators support the cook islands and 16 of these support both teams. how many support only fiji?
Answers: 2
You know the right answer?
The histogram to the right them the times between eruptions of. geyser for a sample of 300 eruptions...
Questions in other subjects:


Mathematics, 30.10.2020 16:50


