Not everyone pays the same price for the same model of
a car. the figure illustrates a normal d...

Mathematics, 17.01.2020 02:31 ellaemtagedeane
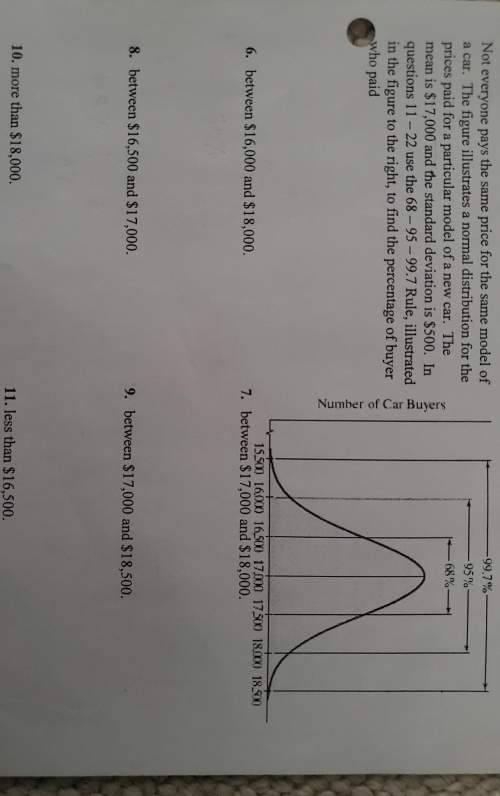
Not everyone pays the same price for the same model of
a car. the figure illustrates a normal distribution for the
prices paid for a particular model of a new car. the
mean is $17,000 and the standard deviation is $500. in
questions 11 - 22 use the 68 - 95 - 99.7 rule, illustrated
in the figure to the right to find the percentage of buyer
who paid
number of car buyers
6. between $16,000 and $18,000.
7. between $17,000 and $18,000.
8. between $16,500 and $17,000.
9. between $17,000 and $18,500.
10. more than $18,000.
11. less than $16,500.

Answers: 1


Other questions on the subject: Mathematics
Mathematics, 21.06.2019 19:00, Goldenstate32
Gh bisects fgi. find the measure of hgi •15° •21° •10° •8°
Answers: 2
You know the right answer?
Questions in other subjects:

Biology, 01.07.2019 04:30

Health, 01.07.2019 04:30

English, 01.07.2019 04:30
Mathematics, 01.07.2019 04:30
English, 01.07.2019 04:30


