
Mathematics, 15.01.2020 10:31 leo4687
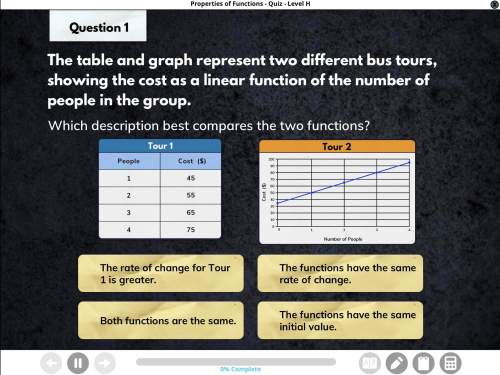
The table and graph represent two different bus tours, showing the cost of a linear function of the number of people in a group. which description best describes the two functions?
plz answer i asked it twice : (

Answers: 1


Other questions on the subject: Mathematics
Mathematics, 21.06.2019 21:00, kordejah348
Sweet t saved 20 percent of the total cost of the green-eyed fleas new album let there be fleas on earth. if the regular price is $30 how much did sweet save
Answers: 1
Mathematics, 21.06.2019 23:30, webbhlharryteach
Ateacher wanted to buy a chair, a bookshelf, two tables and a desk. she spent $900 for all five items and the chair and the desk combined 70% of her total. if the bookshelf cost $50, how much did each of the tables cost?
Answers: 1
Mathematics, 22.06.2019 02:50, salazarx062
There are 85 apples on the big tree, john picked out 15%. how many did john pick out?
Answers: 2
You know the right answer?
The table and graph represent two different bus tours, showing the cost of a linear function of the...
Questions in other subjects:

English, 15.06.2021 16:50

Mathematics, 15.06.2021 16:50
Mathematics, 15.06.2021 16:50

Biology, 15.06.2021 16:50


