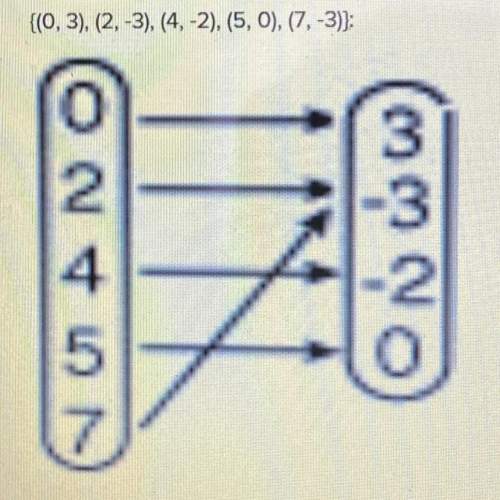
Click through the graphics and select the one that accurately represents the relation
{(o, 3),...

Mathematics, 09.01.2020 19:31 challenggirl
Click through the graphics and select the one that accurately represents the relation
{(o, 3), (2, -3), (4, -2), (5, o), (7, -3)}:

Answers: 2


Other questions on the subject: Mathematics
Mathematics, 21.06.2019 23:20, coralstoner6793
This graph shows which inequality? a ≤ –3 a > –3 a ≥ –3 a < –3
Answers: 1
Mathematics, 22.06.2019 00:00, jadfavors4321
Parallelogram efgh is a rectangle. he = 6, and fe = 8. find ge: and find fj:
Answers: 1
You know the right answer?
Questions in other subjects:

Biology, 03.02.2020 11:04


History, 03.02.2020 11:04
Mathematics, 03.02.2020 11:04
Mathematics, 03.02.2020 11:04


