
Mathematics, 09.01.2020 00:31 arosh7765
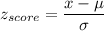
Example 1: calculation of normal probabilities using and tables of standard normal areas the u. s. department of agriculture (usda), in its official food plans
(), states that the average cost of food for a 14- to 18-year-old male (on the moderate-cost plan) is $261.50 per month. assume that the monthly food
cost for a 14- to 18-year-old male is approximately normally distributed with a mean of $261.50 and a standard deviation of $16.25.
a. use a table of standard normal curve areas to find the probability that the monthly food cost for a randomly selected 14- to 18-year-old male is
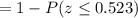
i. less than $280.
ii. more than $270.
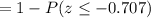
iii. more than $250.
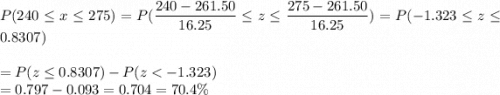
iv. between $240 and $275.
b. explain the meaning of the probability that you found in part (a)(iv).

Answers: 1


Other questions on the subject: Mathematics
Mathematics, 21.06.2019 19:40, love0000
Atextile fiber manufacturer is investigating a new drapery yarn, which the company claims has a mean thread elongation of 12 kilograms with a standard deviation of 0.5 kilograms. the company wishes to test the hypothesis upper h subscript 0 baseline colon mu equals 12 against upper h subscript 1 baseline colon mu less-than 12 using a random sample of n equals 4 specimens. calculate the p-value if the observed statistic is x overbar equals 11.8. round your final answer to five decimal places (e. g. 98.76543).
Answers: 3
Mathematics, 21.06.2019 20:00, naimareiad
Ialready asked this but i never got an answer. will give a high rating and perhaps brainliest. choose the linear inequality that describes the graph. the gray area represents the shaded region. y ≤ –4x – 2 y > –4x – 2 y ≥ –4x – 2 y < 4x – 2
Answers: 1
You know the right answer?
Example 1: calculation of normal probabilities using and tables of standard normal areas the u. s....
Questions in other subjects:
Mathematics, 13.09.2020 02:01
Mathematics, 13.09.2020 02:01

Biology, 13.09.2020 02:01
Mathematics, 13.09.2020 02:01

English, 13.09.2020 02:01
Mathematics, 13.09.2020 02:01
Mathematics, 13.09.2020 02:01
Mathematics, 13.09.2020 02:01
Mathematics, 13.09.2020 03:01
Mathematics, 13.09.2020 03:01


