


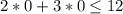
 ....This is true so we shade the lower half plane as shown in the attachment.
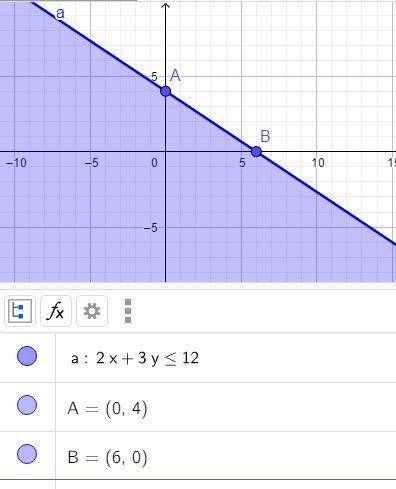
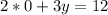
Graph the linear inequality: 2x + 3y = 12, by creating a t-chart to plot the points. shade by
...

Mathematics, 27.12.2019 03:31 Mevans5602
Graph the linear inequality: 2x + 3y = 12, by creating a t-chart to plot the points. shade by
testing a point and show all of your work

Answers: 3


Other questions on the subject: Mathematics
Mathematics, 21.06.2019 20:30, elenaabad18
Ateacher brought a pack of 17 batteries . each calculator uses 3 batteries . how many calculator can the teacher fill with batteries
Answers: 2
Mathematics, 21.06.2019 21:30, cocoj3205
Amir wants to proportionally increase the size of a photo to create a poster for his room. the size of the original photo is shown. complete the statement and then answer the question to represent ways that amir can increase the size of his photo.
Answers: 2
Mathematics, 22.06.2019 00:00, hadilalhjajih
The amount cami raised during last year’s charity walk, $45.50, is 7/10 of the amount she raised this year. which equation represents n, the number of dollars she raised this year?
Answers: 2
You know the right answer?
Questions in other subjects:


Biology, 04.01.2021 14:00


Biology, 04.01.2021 14:00


Chemistry, 04.01.2021 14:00
English, 04.01.2021 14:00
Biology, 04.01.2021 14:00


