
Mathematics, 24.12.2019 22:31 AgentPangolin
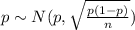
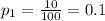
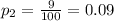
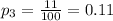
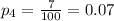
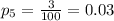
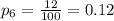
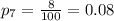
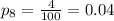
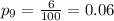
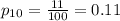
1) ten samples of a process measuring the number of returns per 100 receipts were taken for a local retail store.
the number of returns were 10, 9, 11, 7, 3, 12, 8, 4, 6, and 11.
find the standard deviation of the sampling distribution for the p-bar chart.
a) there is not enough information to answer the question.
b) .081
c) 8.1
d) .0273
e) .0863

Answers: 1


Other questions on the subject: Mathematics
Mathematics, 21.06.2019 15:20, alaina3792
Which equation represents a circle with a center at (–3, –5) and a radius of 6 units? (x – 3)2 + (y – 5)2 = 6 (x – 3)2 + (y – 5)2 = 36 (x + 3)2 + (y + 5)2 = 6 (x + 3)2 + (y + 5)2 = 36
Answers: 3
Mathematics, 21.06.2019 15:50, cluchmasters3831
How many zeros does the function f(x)=4x3-x2+1 have
Answers: 1
Mathematics, 22.06.2019 00:30, anitadefrances
What is the perimeter of an equilateral triangle if each side is (x+3)?
Answers: 1
You know the right answer?
1) ten samples of a process measuring the number of returns per 100 receipts were taken for a local...
Questions in other subjects:

Mathematics, 05.03.2021 05:30


Social Studies, 05.03.2021 05:30
Mathematics, 05.03.2021 05:30

Chemistry, 05.03.2021 05:30
Mathematics, 05.03.2021 05:30


