
Mathematics, 19.12.2019 04:31 tony7135
Suppose data made available through a health system tracker showed health expenditures were $10,348 per person in the united states. use $10,348 as the population mean and suppose a survey research firm will take a sample of 100 people to investigate the nature of their health expenditures. assume the population standard deviation is $2,500.
(b) what is the probability the sample mean will be within ±$100 of the population mean? (round your answer to four decimal places.)
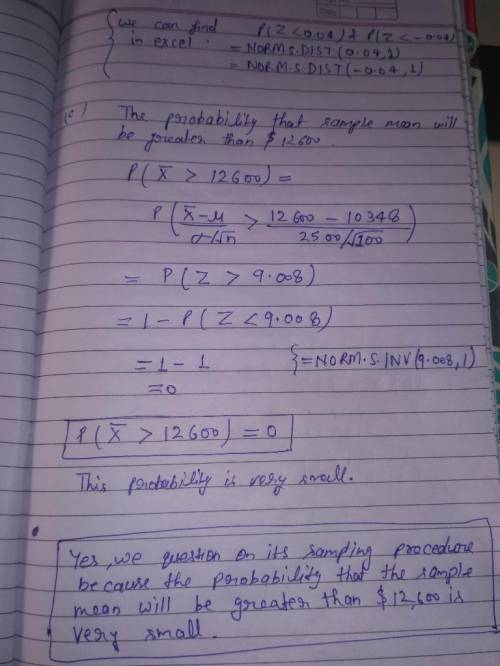
(c) what is the probability the sample mean will be greater than $12,600? (round your answer to four decimal places.)
if the survey research firm reports a sample mean greater than $12,600, would you question whether the firm followed correct sampling procedures? why or why not?
a) no, because $12,600 is within one standard deviation of $10,348.
b) no, because the probability that the sample mean will be greater than $12,600 is very large.
c) yes, because $12,600 is not within ±$100 of the population mean.
d) yes, because the probability that the sample mean will be greater than $12,600 is very small.

Answers: 3


Other questions on the subject: Mathematics
Mathematics, 21.06.2019 20:00, chantelporter713
Afamily has five members. a mom, a dad, two sisters, & a brother. the family lines up single file. what is the probabillity that the mom is at the front of the line
Answers: 1
Mathematics, 21.06.2019 20:20, makaylacroy02
Drag the tiles to the correct boxes to complete the pairs. not all tiles will be used. identify the domain for each of the given functions.
Answers: 1
Mathematics, 21.06.2019 22:30, minnahelhoor
How do i find the missing angle measure in a polygon
Answers: 1
Mathematics, 21.06.2019 23:00, tfyvcu5344
The weight of a radioactive isotope was 96 grams at the start of an experiment. after one hour, the weight of the isotope was half of its initial weight. after two hours, the weight of the isotope was half of its weight the previous hour. if this pattern continues, which of the following graphs represents the weight of the radioactive isotope over time? a. graph w b. graph x c. graph y d. graph z
Answers: 2
You know the right answer?
Suppose data made available through a health system tracker showed health expenditures were $10,348...
Questions in other subjects:

Mathematics, 24.09.2020 15:01

Social Studies, 24.09.2020 15:01
Mathematics, 24.09.2020 15:01


Mathematics, 24.09.2020 15:01


