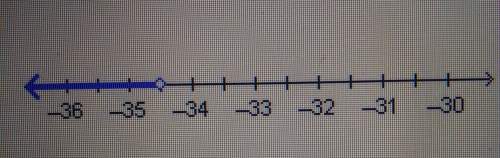
Which inequality is represented by this graph?
a. -34.5 > х
b. -34.5< x
c. -3...

Mathematics, 18.12.2019 04:31 onlymyworld27
Which inequality is represented by this graph?
a. -34.5 > х
b. -34.5< x
c. -35.5 > x
d. –35.5 < x

Answers: 1


Other questions on the subject: Mathematics
Mathematics, 21.06.2019 16:00, yurimontoya759
12. the amount of money in a bank account decreased by 21.5% over the last year. if the amount of money at the beginning of the year is represented by ‘n', write 3 equivalent expressions to represent the amount of money in the bank account after the decrease?
Answers: 2
Mathematics, 21.06.2019 22:30, dancer4life5642
Question 3(multiple choice worth 1 points) use the arc length formula and the given information to find r. s = 16 cm, θ = 48°; r = ? sixty divided by pi cm thirty divided by pi cm one third cm one hundred twenty divided by pi cm
Answers: 1
You know the right answer?
Questions in other subjects:


