Step-by-step explanation:
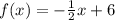
The equation of the line in Slope-Intercept form is:

Where "m" is the slope and "b" is hte y-intercept.
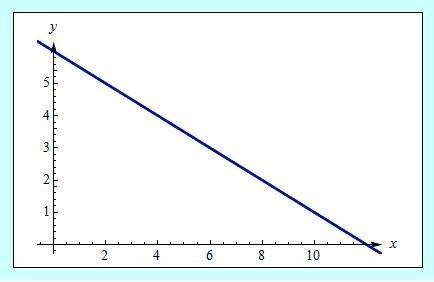
In this case, you can identify in the graph that the y-intercept is:

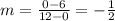
By definition, the slope can be calculated with this formula:

Then, in order to find the slope, you can pick the points (0,6) and (12,0) and say that:

So, substituting these values into the formula, you get:
Therefore, the function represented by the given graph is: