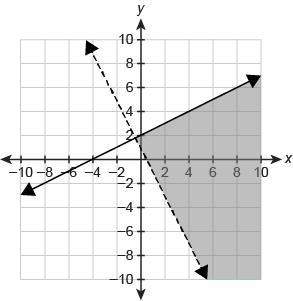
The graph in the attached figure
Step-by-step explanation:
we have
 ----> inequality A
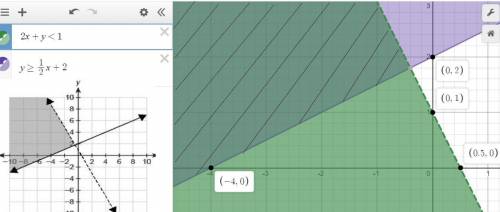
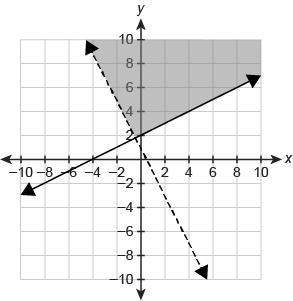
The solution of the inequality A is the shaded area below the dashed line 
The slope of the dashed line is negative m=-2
The y-intercept of the dashed line is the point (0,1)
The x-intercept of the dashed line is (0.5,0)
 ----> inequality B
The solution of the inequality B is the shaded area above the solid line 
The slope of the solid line is positive m=1/2
The y-intercept of the solid line is the point (0,2)
The x-intercept of the solid line is (-4,0)
using a graphing tool
The solution of the system of inequalities is the shaded area below the dashed line A and above the solid line B
The graph in the attached figure