Mathematics, 10.12.2019 05:31 Slycooper5959
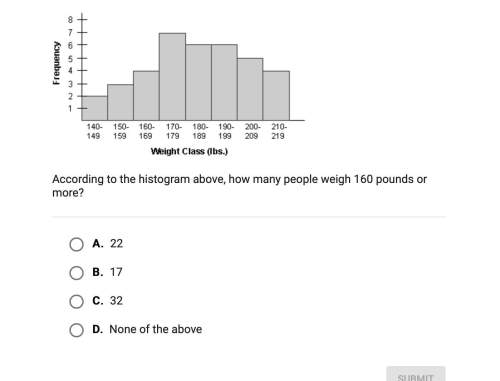
Look at the variable "payroll" in the data set "payroll". it has 50 values, all between 100 and 400. count the number of values in each of the intervals 100 160, 160 220, 220 - 280, 280 - 340, 340 - 400. can you conclude that this data does not come from the uniform distribution on the interval (100,400)? (hint: if the distrbution is uniform, what is the expected count in each interval) the counting can be done with r's histogram fiunction > paycounts-hist (payrollspayroll, breaks-seq(100,400,60))scounts > paycounts do the calculations by hand, except for finding the p-value. then check your work by using r's "chisq. test" function > chisq. test (paycounts)

Answers: 1


Other questions on the subject: Mathematics

Mathematics, 21.06.2019 20:00, Jenifermorales101
It is given that the quadratic equation hx²-3x+k=0, where h and k are constants, has roots [tex] \beta \: and \: 2 \beta [/tex]express h in terms of k
Answers: 2

Mathematics, 21.06.2019 22:00, Mgarcia325
Apackage of five erasers cost 0. $.39 at this rate how many how much would 60 erasers cost in dollars and cents
Answers: 2


Mathematics, 22.06.2019 00:00, camila9022
Tatiana reads 40 pages of her book every night for x number of nights. write an expression that shows the number of pages she has read
Answers: 3
You know the right answer?
Look at the variable "payroll" in the data set "payroll". it has 50 values, all between 100 and 400....
Questions in other subjects:


Mathematics, 11.11.2021 14:00


Chemistry, 11.11.2021 14:00


Mathematics, 11.11.2021 14:00


