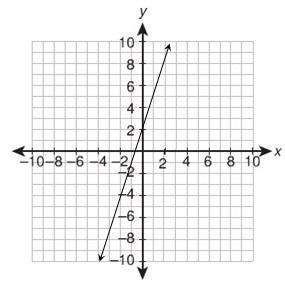
y-5=3(x-1)
Step-by-step explanation:
The graph shows an equation y=a+bx, that has an intercept "a", in a=2 (value of y when x=0), and a slope "b", b=3 (to see the slope, watch the change in y when x changes a unit, remembering that each square in the graph represents a unit - for example, when y=2, a change on x, from x=0 to x=1 would result in y=6).Then, to know wich of the equations presented is the one that represent the graph, we should search that equation that meets the following requirements: intercept a=2 and slope b=3.The first expression can be rewrite as follows: y=6-13x (to arrive to this expression, we apply distributive property in the right ide of the equation, and then we sum 4 both sides of the equation). This equation does not meet our requirements.The second expression can be rewrite as follows: y=4+13x (we apply the same steps than we apply in the previous example). Again, this equation does not meet the requirements (intercept a=2 and slope b=3).The third expression can be rewrite as follows: y=1-3x (to arrive to this expression, we apply distributive property on the right side of the equation, and then we subtract 2 both sides of the equation. This expression does not meet the requirements either.Finally, the last equation can be rewrite like y=2+3x (to arrive to this expressionn, we apply distributive property in thesecond side of the equation, and then we add 5 both sides of the equation. This expression actually meet the requirements! It has an intercept equal to 2 and its slope is 3.