
Mathematics, 07.12.2019 02:31 zoewilliamss26
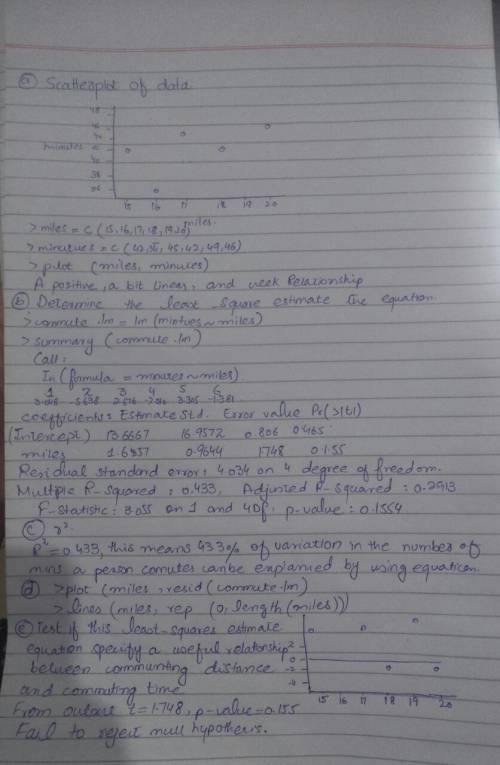
The following data is looking at how long it takes to get to work. let x = commuting distance (miles) and y = commuting time (minutes) x 15 16 17 18 19 20 y 42 35 45 42 49 46
a. give a scatterplot of this data and comment on the direction, form and strength of this relationship.
b. determine the least-squares estimate equation for this data set.
c. give the r2, comment on what that means.
d. give the residual plot based on the least-squares estimate equation.
e. test if this least-squares estimate equation specify a useful relationship between commuting distance and commuting time.

Answers: 2


Other questions on the subject: Mathematics
Mathematics, 21.06.2019 22:30, rubycarbajal
The area of a circle is equal to 1 dm². find the radius of the circle.
Answers: 1
Mathematics, 22.06.2019 03:30, nakeytrag
An architect builds a model of a park in the shape of a rectangle. the model is 40.64 centimeters long and 66.04 centimeters wide. one inch equals 2.54 centimeters. use the ratio table to find the ratio of the length to the sum of the length and width in inches and in simplest form. length 40.64 width 66.04 a. 8: 21 b. 13: 21 c. 21: 13 d. 21: 8
Answers: 1
You know the right answer?
The following data is looking at how long it takes to get to work. let x = commuting distance (miles...
Questions in other subjects:

Arts, 15.10.2020 14:01

History, 15.10.2020 14:01
Mathematics, 15.10.2020 14:01

English, 15.10.2020 14:01
Mathematics, 15.10.2020 14:01

History, 15.10.2020 14:01


