
Mathematics, 06.12.2019 01:31 tchou8306
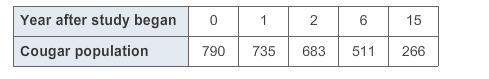
Scientists studied two animal populations. function f(x) = 830(0.8)x models a bear population in a given region x years after the study began. the table models the cougar population in the same region. fifteen years after the study began, about how many times greater was the cougar population than the bear population?
a.9times
b.18times
c.5times
d.2.5times

Answers: 1


Other questions on the subject: Mathematics
Mathematics, 21.06.2019 16:20, elkinsmarie88oyzd23
What are the soultion(s) to the quadratic equation 40- x^2=0
Answers: 1
Mathematics, 21.06.2019 18:00, ddoherty88
How much dextrose 70% must be mixed with dextrose 5% to prepare 1,000 ml of dextrose 20%?
Answers: 1
Mathematics, 21.06.2019 21:50, salazarx062
Which of the following is the graph of y= square root -x-3
Answers: 1
You know the right answer?
Scientists studied two animal populations. function f(x) = 830(0.8)x models a bear population in a g...
Questions in other subjects:

History, 10.06.2021 01:20


Arts, 10.06.2021 01:20

Mathematics, 10.06.2021 01:20


