
Mathematics, 05.12.2019 07:31 granthazenp5e9mj
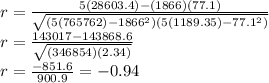
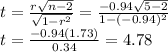
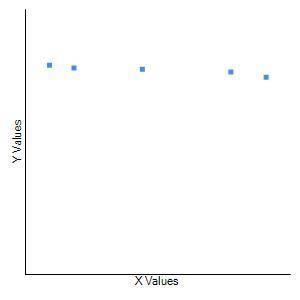
Listed below are annual data for various years. the data are weights (metric tons) of imported lemons and car crash fatality rates per 100,000 population. construct a scatterplot, find the value of the linear correlation coefficient r, and find thep-value using α=0.05. is there sufficient evidence to conclude that there is a linear correlation between lemon imports and crash fatality rates? do the results suggest that imported lemons cause car fatalities?
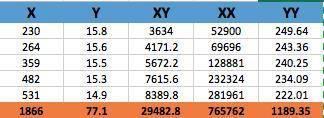
lemon_imports_(x) crash_fatality_rate_(y)
230 15.8
264 15.6
359 15.5
482 15.3
531 14.9
what are the null and alternative hypotheses?

Answers: 1


Other questions on the subject: Mathematics
Mathematics, 21.06.2019 19:00, yehnerthannah
Through non-collinear points there is exactly one plane.
Answers: 1
Mathematics, 21.06.2019 19:00, rodriguezzamyy
There is an entrance to the computer room at point e which lies on ab and is 5 feet from point a. plot point e on the coordinate plane. find the distance from the entrance at point e to the printer at point e
Answers: 1
Mathematics, 21.06.2019 20:00, lucerogon7403
How can you construct perpendicular lines and prove theorems about perpendicular lines
Answers: 3
You know the right answer?
Listed below are annual data for various years. the data are weights (metric tons) of imported lemon...
Questions in other subjects:


