
Mathematics, 05.12.2019 04:31 sniron
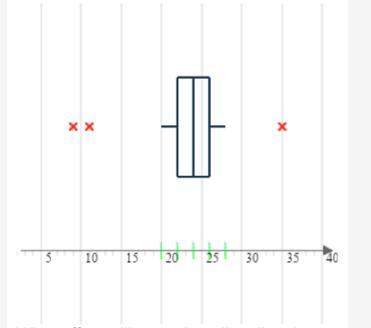
the boxplot below displays the average number of jumbo marshmallows consumed in eating contests across a particular state. the higher outlier is from a professional, heavyweight contest, and the lower outliers are from children's eating contests.
what effect will removing all outliers have on the mean and median of the data set?
a.) neither the mean nor the median will change.
b.) the median will change and the mean will increase.
c.) the median will change and the mean will decrease.
d.) the mean will remain unchanged and the median will increase.

Answers: 2


Other questions on the subject: Mathematics
Mathematics, 21.06.2019 17:30, liaholmes8
If i have one apple and give you the apple, how many apples do i have?
Answers: 2
You know the right answer?
the boxplot below displays the average number of jumbo marshmallows consumed in eating contests acro...
Questions in other subjects:


