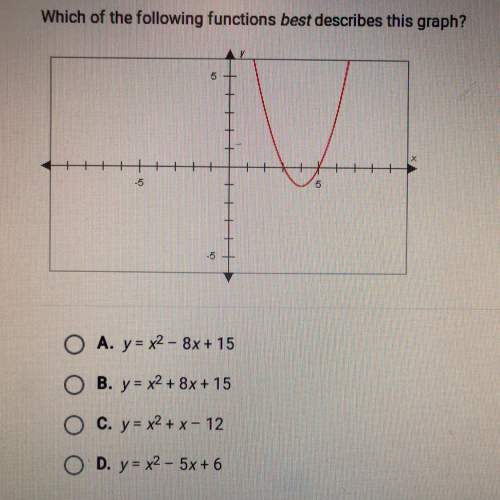
Which of the following functions best describes this graph?
a) y= х2 – 8х + 15
в) y= х2...

Mathematics, 04.12.2019 21:31 fainet
Which of the following functions best describes this graph?
a) y= х2 – 8х + 15
в) y= х2 + 8х + 15
c) у= х2 +х- 12
d) y= х2 – 5х +6

Answers: 1


Other questions on the subject: Mathematics
Mathematics, 22.06.2019 03:30, hajoshh
Atown recently dismissed 5 employees in order to meet their new budget reductions. the town had 5 employees over 50 years of age and 19 under 50. if the dismissed employees were selected at random, what is the probability that exactly 2 employees were over 50? express your answer as a fraction or a decimal number rounded to four decimal places.
Answers: 1
Mathematics, 22.06.2019 05:00, saskiat8549
What exclusions are placed on the variable x for the fraction = ? - 0 -1 none
Answers: 1
You know the right answer?
Questions in other subjects:


