
Mathematics, 03.12.2019 21:31 alinegonzalez0027
1. a relation is plotted as a linear function on a coordinate plane starting at point c at (3, –2) and ending at point d at (–2, 3). what is the rate of change for the linear function and what is its initial value?
the rate of change is and the initial value is
a. 1 and -1
b. -1 and 1
c. 5 and -2
d. -2 and 5
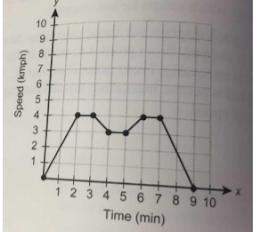
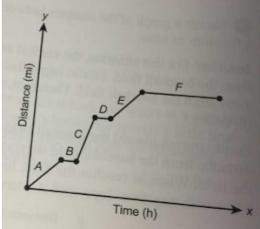
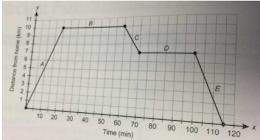
2. ava drove her car at a constant rate to the train station. at the train station, she waited for the train to arrive. after she boarded the train, she traveled at a constant rate, faster than she drove her car. she entered the taxi and traveled at a constant speed. this speed was equal to the speed at which she had driven her car earlier. after some time, she arrived at her destination.
which graph represents ava’s travel plans? (first 3 graphs are the options to this question.)

Answers: 2


Other questions on the subject: Mathematics
Mathematics, 22.06.2019 02:30, homeschool0123
Solve the compound inequality. graph your solution. 2x – 2 < –12 or 2x + 3 > 7 x < –5 or x > 5 x < –5 or x > 2 x < –12 or x > 2 x < –7 or x > 5
Answers: 2
Mathematics, 22.06.2019 04:20, jessiejohnsonjr123
Michael gose to a theme park and rides two different roller coasters that both begin on a raised platform his height while on the first roller coaster measured in feet from the platform height can be modeled by the following graph where t is the number of seconds since the ride began
Answers: 2
You know the right answer?
1. a relation is plotted as a linear function on a coordinate plane starting at point c at (3, –2) a...
Questions in other subjects:

Social Studies, 02.09.2019 19:30

History, 02.09.2019 19:30
History, 02.09.2019 19:30

Biology, 02.09.2019 19:30
Mathematics, 02.09.2019 19:30

Social Studies, 02.09.2019 19:30


