
Mathematics, 29.11.2019 00:31 LindaCat78
Country financials, a financial services company, uses surveys of adults age 18 and older to determine if personal financial fitness is changing over time. in february 2012, a sample of 1000 adults showed 410 indicating that their financial security was more that fair. in feb 2010, a sample of 900 adults showed 315 indicating that their financial security wwas more than fair.
1.state the hypothesis that can be used to test for a significant difference between the population proportions for the two years?
2.what is the sample proportion indicating that theirfinancial security was more that fair in 2012? in 2010?
3.conduct the hypothesis test and compute the p-value. at a .05 level of significance what is your conclusion?
4.what is the 95% confidence interval estimate of the difference between the two population proportion?

Answers: 1


 always
  so we can conclude that we have enough evidence to reject the null hypothesis, and we can say the the proportion of people sampled in 2012 is significantly different than the porportion samples in 2010.
  represent the number of people in 2012 indicating that their financial security was more that fair
 represent the number of people in 2010 indicating that their financial security was more that fair
 sample in 2012 selected
 sample in 2010 selected
  represent the proportion of people in 2012 indicating that their financial security was more that fair
 represent the proportion of people in 2010 indicating that their financial security was more that fair
 represent the value for the test (variable of interest)
  (1)
(1) 
 , but we can calculate the p value for this test.
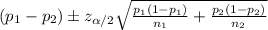


Other questions on the subject: Mathematics
Mathematics, 21.06.2019 16:00, ramirezzairap2u4lh
Data are collected to see how many ice-cream cones are sold at a ballpark in a week. day 1 is sunday and day 7 is the following saturday. use the data from the table to create a scatter plot.
Answers: 2
Mathematics, 21.06.2019 18:30, thefandomarmy24
Factor k2 - 17k + 16. a.(k - 2)(k - 8) b.(k - 1)(k + 16) c.(k - 1)(k - 16)
Answers: 1
Mathematics, 21.06.2019 23:00, eduardoma2902
Solve for x: 5/3 x = 20/21 it's fraction. remember to simplify your fraction
Answers: 2
You know the right answer?
Country financials, a financial services company, uses surveys of adults age 18 and older to determi...
Questions in other subjects:

Mathematics, 27.06.2019 15:00

History, 27.06.2019 15:00
Mathematics, 27.06.2019 15:00

English, 27.06.2019 15:00


