
Mathematics, 27.11.2019 22:31 johnsonkia873
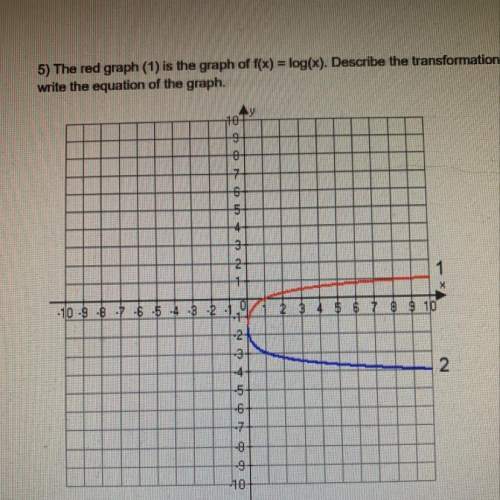
The red graph (1) is the graph of f(x) = log(x). describe the transformation of the blue function (2) and write the equation of the graph.

Answers: 3


Other questions on the subject: Mathematics
Mathematics, 21.06.2019 14:00, angellv917
At the many chips cookie company they are serious about the number of chocolate chips in their cookies they claim that each cookie hasn't c chips. if their claim is true there will be 200 chips in 10 cookies
Answers: 2
Mathematics, 21.06.2019 23:50, BreBreDoeCCx
You so much whoever answers with accuracy •the parent function of the graph of f(x) is the square root function, which was reflected across the x-axis. which of the following is the equation of f(x)?
Answers: 1
You know the right answer?
The red graph (1) is the graph of f(x) = log(x). describe the transformation of the blue function (2...
Questions in other subjects:

Mathematics, 30.07.2020 21:01
Mathematics, 30.07.2020 21:01
Mathematics, 30.07.2020 21:01


