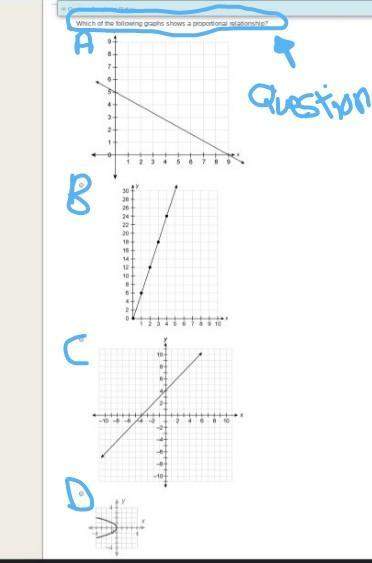
Which of the following graphs shows a proportional relationship?
i think it's b but not...

Mathematics, 26.11.2019 23:31 dsperez201938
Which of the following graphs shows a proportional relationship?
i think it's b but not sure

Answers: 2


Other questions on the subject: Mathematics
Mathematics, 21.06.2019 22:00, harry5112
Acaterer charges $500 plus $30 per guest to cater a wedding. walt and traci don't want to spend more than $8000 on catering. write and solve an inequality in terms of the number of guests, g, that can be invited. a) 30g ? 8000; g ? 267 b) 500g < 8000; g < 16 c) 500 + 30g < 8000; g < 250 d) 500 + 30g ? 8000; g ? 250
Answers: 1
Mathematics, 22.06.2019 01:30, karsenbeau
Given are five observations for two variables, x and y. xi 1 2 3 4 5 yi 3 7 5 11 14 which of the following is a scatter diagrams accurately represents the data? what does the scatter diagram developed in part (a) indicate about the relationship between the two variables? try to approximate the relationship betwen x and y by drawing a straight line through the data. which of the following is a scatter diagrams accurately represents the data? develop the estimated regression equation by computing the values of b 0 and b 1 using equations (14.6) and (14.7) (to 1 decimal). = + x use the estimated regression equation to predict the value of y when x = 4 (to 1 decimal). =
Answers: 3
You know the right answer?
Questions in other subjects:


Biology, 04.09.2020 19:01


