
Mathematics, 26.11.2019 00:31 mahagonylyric
Suppose ted, a sociologist, is interested in comparing the amount of time that husbands and wives in the united states each spend on social media. he suspects that the average time spent on social media by husbands differs from the average time spent by wives. ted randomly selects 41 heterosexual married couples from a u. s. census database and asks each spouse how much time they spend on social media in a typical week. next, he computes the difference in social media usage time between the husband and wife for each couple by subtracting the wife's time online from her husband's time online. ted's set of calculated differences has a sample mean of -1.22 h and a sample standard deviation of 1.17 h. although the distribution of intramarital social media usage differences in the population is unknown, the sample data have a single peak and are fairly symmetric. the normal probability plot and boxplot show a slight skew to the left with no strong outliers.
select the statement that accurately evaluates whether or not a matched-pairs t-test is valid in ted's experiment. o
a. a matched-pairs t-test is valid, despite the sample being a small representation of the population, because the sample is a simple random sample and has a distribution with a single peak.
b. a matched-pairs t-test is valid because a simple random sample of sufficient size is obtained from a large population and no outliers are in the set of differences, which have an unknown population standard deviation.
c. a matched-pairs t-test is not valid because information about the data distributions and outlier status of the separate husband and wife samples is not provided.
d. a matched-pairs t-test is not valid because the sampling distribution is skewed left, which makes the distribution less symmetric, and, therefore, the assumption of normality has been violated.
e. a matched-pairs t-test is not valid because this experiment needs a two-sample t-test using the social media usage data collected from the sample of husbands and from the sample of wives.

Answers: 2


Other questions on the subject: Mathematics
Mathematics, 21.06.2019 17:00, gomez36495983
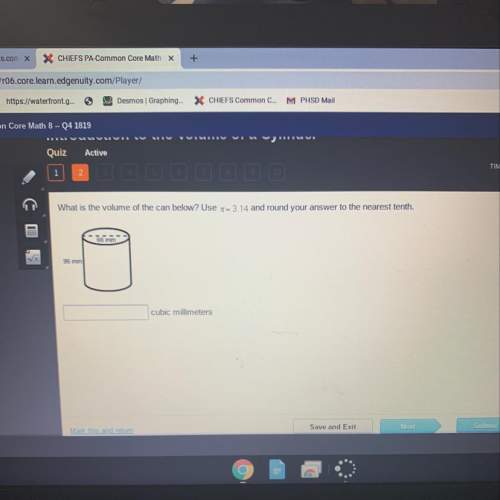
() at a farm, animals are fed bales of hay and buckets of gain. each bale of hay is in the shape of a rectangular prism. the base side lengths 2 feet and 3 feet, and the height is 5 feet. each bucket of grain is a cylinder with diameter of 3 feet. the height of the bucket is 5 feet as the height of bale. a. which is larger in area, the rectangular base of the bale or the circular base of the bucket? explain how you know b. which is larger in volume, the bale or the bucket? explain how you know
Answers: 1
Mathematics, 21.06.2019 19:30, tsmalls70988
What is the image of c for a 90° counterclockwise rotation about a? (3, 7) (-1, 3) (7, 3)
Answers: 1
Mathematics, 21.06.2019 20:00, villarrealc1987
The function models the number of accidents per 50 million miles driven as a function
Answers: 1
You know the right answer?
Suppose ted, a sociologist, is interested in comparing the amount of time that husbands and wives in...
Questions in other subjects:
Mathematics, 19.10.2019 22:30

Chemistry, 19.10.2019 22:30

Mathematics, 19.10.2019 22:30
Mathematics, 19.10.2019 22:30


Business, 19.10.2019 22:30


