Plz !
part b
1. which of the following lines of best fit represent the data...

Mathematics, 23.11.2019 01:31 chickenwing32
Plz !
part b
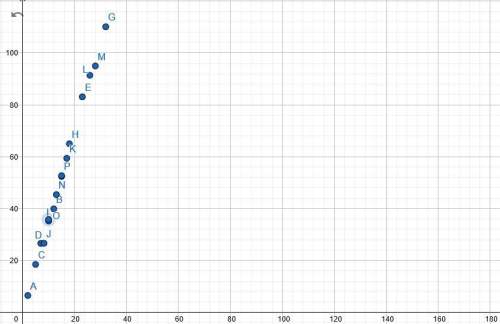
1. which of the following lines of best fit represent the data if x is the number of days since the plant appeared and y is the height of the plant?
a. y = –3.5x + 0.7 wrong
b. y = –0.7x + 3.5 wrong
c. y = 0.7x + 3.5 wrong
d. y = 3.5x + 0.7 correct
2. explain why your choice of equations best fits the data. explain what the slope and y-intercept of the line of best fit mean about the bamboo plants.
part c
use the line of best fit chosen in part b to predict the height of a bamboo plant 40 days after appearing above the soil. show your work.

Answers: 1


Other questions on the subject: Mathematics
Mathematics, 21.06.2019 19:30, vtrvfrfvrvfvnkjrf
What is the slope of the line shown below?
Answers: 2
Mathematics, 21.06.2019 21:00, ballbritez
Which line is parallel to the line that passes through the points (2, –5) and (–4, 1) a. y=-x+5 b. y=-2/3x+3 c. y=2/3x-2 d. y=x+5
Answers: 2
Mathematics, 21.06.2019 22:50, tali2561
Aclassroom is made up of 11 boys and 14 girls. the teacher has four main classroom responsibilities that she wants to hand out to four different students (one for each of the four students). if the teacher chooses 4 of the students at random, then what is the probability that the four students chosen to complete the responsibilities will be all boys?
Answers: 1
You know the right answer?
Questions in other subjects:


History, 27.05.2020 22:05
Mathematics, 27.05.2020 22:05

English, 27.05.2020 22:06

Mathematics, 27.05.2020 22:06

Computers and Technology, 27.05.2020 22:06
Mathematics, 27.05.2020 22:06


