Look at the graph.
leslie analyzed the graph to determine if the function it represents is lin...

Mathematics, 22.11.2019 19:31 abby6628
Look at the graph.
leslie analyzed the graph to determine if the function it represents is linear or non-linear. first she
graph to be (-1.-4), (0.-3), and (2.5). next, she determined the rate of change between the point
-) 1

Answers: 2


Other questions on the subject: Mathematics


Mathematics, 22.06.2019 01:00, nicolew647
Which of the following is equal to the rational expression when x is not equal to -2 or -6?
Answers: 2

Mathematics, 22.06.2019 01:30, alinamartinez9p752cj
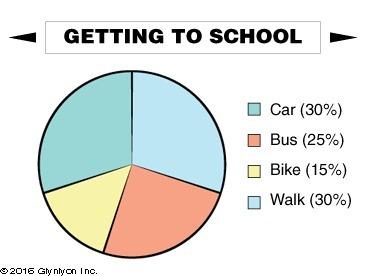
Which of the following statements is a true conclusion that can be made from the scaled bargraph?
Answers: 1
You know the right answer?
Questions in other subjects:


Mathematics, 22.02.2021 19:30


