Sangita drew a graph of her data and the line of
best fit as a visual for her science project....

Mathematics, 21.11.2019 07:31 FatCatcreator
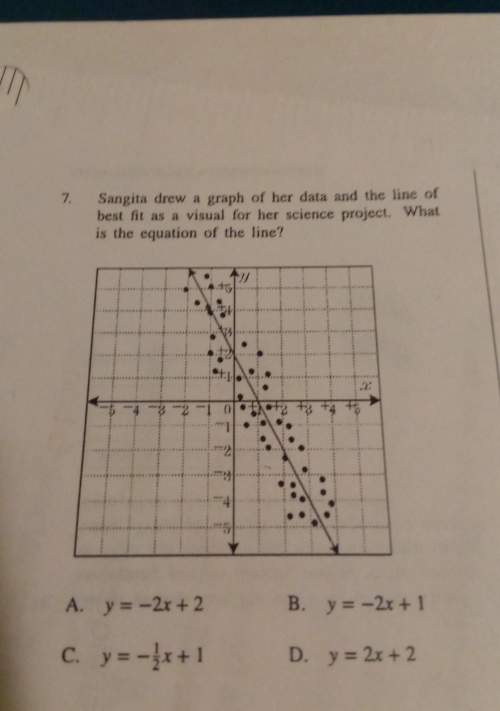
Sangita drew a graph of her data and the line of
best fit as a visual for her science project. what
is the equation of the line?
a. y = –2x+2
c. y - fx+1
b. y=-2x + 1
d. y= 2x+2

Answers: 1


Other questions on the subject: Mathematics
Mathematics, 21.06.2019 21:00, OceanClaws
The area of a rectangle is 10 cm^2. one side of the rectangle is x cm. express the perimeter of the rectangle in terms of x and show that this rectangle cannot have a perimeter of 12 cm. the perimeter of the rectangle in terms of x is __ cm
Answers: 1
Mathematics, 21.06.2019 22:00, zurfluhe
Manuela claims that and are congruent. which statement best describes her claim? she is incorrect because the segments do not have the same orientation. she is incorrect because the segments do not have the same length. she is correct because the segments have the same length. she is correct because the segments have the same orientation.
Answers: 1
Mathematics, 22.06.2019 00:00, emmagbales
Given the diagram below, michael writes, "segment ac is congruent to segment ac." which of the following reasons allow him to write this statement?
Answers: 1
You know the right answer?
Questions in other subjects:

English, 16.02.2022 17:50
Mathematics, 16.02.2022 17:50


Mathematics, 16.02.2022 17:50
English, 16.02.2022 17:50
SAT, 16.02.2022 17:50


