The graph below shows the velocity f(t) of a runner during a certain time interval:
gra...

Mathematics, 16.11.2019 01:31 hana560
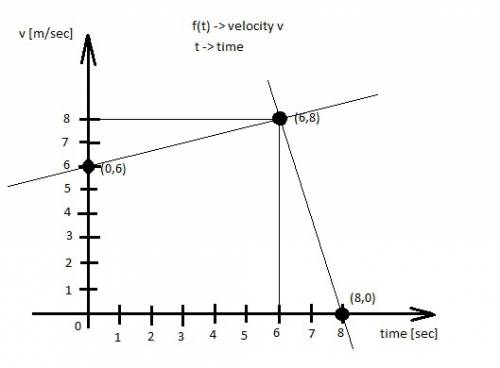
The graph below shows the velocity f(t) of a runner during a certain time interval:
graph of line segment going through ordered pairs 0, 6 and 6, 8. graph of another line segment going through the ordered pairs 6, 8 and 8, 0. label on the x axis is time in seconds and label on the y axis is velocity in meters per second
which of the following describes the intercepts on the graph?
the initial acceleration of the runner was 8 m/s2, and the runner stopped after 6 seconds.
the initial acceleration of the runner was 6 m/s2, and the runner stopped after 8 seconds.
the initial velocity of the runner was 8 m/s, and the runner stopped after 6 seconds.
the initial velocity of the runner was 6 m/s, and the runner stopped after 8 seconds.

Answers: 2


Other questions on the subject: Mathematics
Mathematics, 21.06.2019 17:30, harpermags7830
Which of the following is true for the relation f(x)=2x^2+1
Answers: 1
Mathematics, 21.06.2019 23:30, reycaden
The number of members f(x) in a local swimming club increased by 30% every year over a period of x years. the function below shows the relationship between f(x) and x: f(x) = 10(1.3)xwhich of the following graphs best represents the function? graph of f of x equals 1.3 multiplied by 10 to the power of x graph of exponential function going up from left to right in quadrant 1 through the point 0, 0 and continuing towards infinity graph of f of x equals 10 multiplied by 1.3 to the power of x graph of f of x equals 1.3 to the power of x
Answers: 1
Mathematics, 22.06.2019 00:30, kadinmorgan
The value, v, of kalani’s stock investments over a time period, x, can be determined using the equation v=750(0.80)^-x. what is the rate of increase or decrease associated with this account? 20% decrease 20% increase 25% decrease 25% increase
Answers: 1
You know the right answer?
Questions in other subjects:

History, 03.12.2020 09:00

Mathematics, 03.12.2020 09:00
Mathematics, 03.12.2020 09:00


English, 03.12.2020 09:00


