Need asap
on the first day of june, there were about 17.71 h of daylight in a city. five mont...

Mathematics, 15.11.2019 19:31 LilCookies1
Need asap
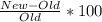
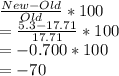
on the first day of june, there were about 17.71 h of daylight in a city. five months later, there were about 5.3 h of daylight. what was the percent decrease?

Answers: 2


Other questions on the subject: Mathematics
Mathematics, 21.06.2019 22:00, prishnasharma34
The two box p digram the two box plots show the data of the pitches thrown by two pitchers throughout the season. which statement is correct? check all that apply. pitcher 1 has a symmetric data set. pitcher 1 does not have a symmetric data set. pitcher 2 has a symmetric data set. pitcher 2 does not have a symmetric data set. pitcher 2 has the greater variation. ots represent the total number of touchdowns two quarterbacks threw in 10 seasons of play
Answers: 1
Mathematics, 21.06.2019 22:30, chrisdelreal86
Ron has 8 caps and 4 of his caps are blue. thes rest of his cap are red. how many of ron's caps are red
Answers: 1
Mathematics, 22.06.2019 00:00, Lions8457
City l has a temperature of −3 °f. city m has a temperature of −7 °f. use the number line shown to answer the questions: number line from negative 8 to positive 8 in increments of 1 is shown. part a: write an inequality to compare the temperatures of the two cities. (3 points) part b: explain what the inequality means in relation to the positions of these numbers on the number line. (4 points) part c: use the number line to explain which city is warmer. (3 points)
Answers: 2
You know the right answer?
Questions in other subjects:

History, 14.01.2020 11:31

Chemistry, 14.01.2020 11:31

Social Studies, 14.01.2020 11:31
Mathematics, 14.01.2020 11:31

History, 14.01.2020 11:31


