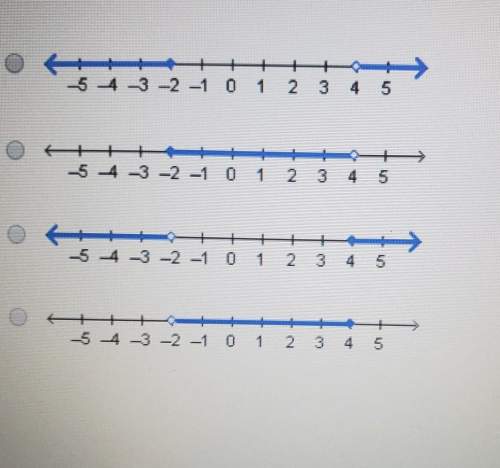
Which graph represents the compound inequality? n< -2 or n> 4
...

Mathematics, 14.11.2019 02:31 krystalruby1219
Which graph represents the compound inequality? n< -2 or n> 4

Answers: 2


Other questions on the subject: Mathematics
Mathematics, 21.06.2019 16:30, mustafajibawi1
A(t)=728(1+0.04)^t how much money did aditya originally invest
Answers: 1
Mathematics, 21.06.2019 16:40, naomicervero
Which of the following is the correct equation for this function? a. y= (x+4)(x+2) b. y=x^2+ 3x – 2 c. y+ 2 = – 2(x+3)^2 d. y+ 2 = 2(x+3)^2
Answers: 1
You know the right answer?
Questions in other subjects:

Geography, 19.04.2021 04:10
Geography, 19.04.2021 04:10

Mathematics, 19.04.2021 04:10


Arts, 19.04.2021 04:10

Spanish, 19.04.2021 04:10


