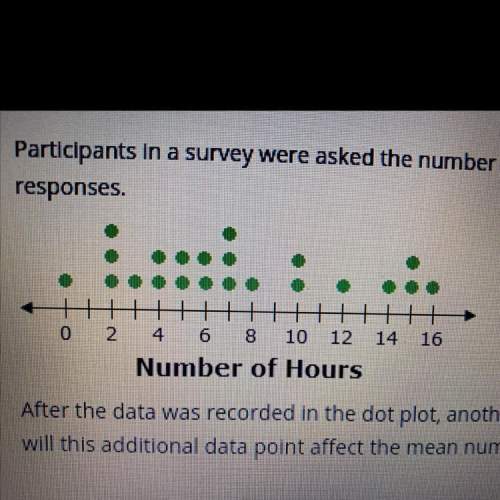
Select the correct answer. the dot plot shows the distribution of their distribution participants in a survey were asked the number of hours of television they watch each week. the dot plot shows the distribution of their responses.
after the data was recorded in the dot plot, another response was found for a participant who watches 30 hours of television will this additional data point affect the mean number of hours of television watched each wiek?
a. the mean number of hours will remain the same.
b. the mean number of hours will decrease.
c. the effect on the mean number of hours cannot be determined.
If myesha works overtime, she gets paid "time and a half" for every hour she works. in other words, for every hour over 40 hours myesha works each week, she gets her hourly pay plus half her hourly pay. what is myesha's pay per hour when she works overtime?
The cost of turkey is directly proportional to its weight. if a 12-pount turkey costs $27, how much does a 16-pound turkey cost? a. $33.75 b. $36.00 c. $31.00 d. $32.50