
Mathematics, 12.11.2019 20:31 lily0806
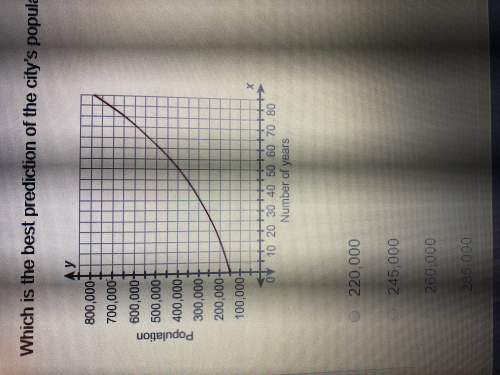
The graph shows a city’s expected population for a number of years after a census. which is the best prediction of the city’s population 25 years after the census?
•220,000
•245,000
•260,000
•285,000

Answers: 1


Other questions on the subject: Mathematics
Mathematics, 21.06.2019 18:00, Mrlittlefish
What is the location of point g, which partitions the directed line segment from d to f into a 5: 4 ratio? –1 0 2 3
Answers: 1
Mathematics, 21.06.2019 21:30, jstringe424
This is a map of the mars exploration rover opportunity predicted landing site on mars. the scale is 1cm : 9.4km. what are the approximate measures of the actual length and width of the ellipse? i mostly need to know how to set it up : )
Answers: 3
You know the right answer?
The graph shows a city’s expected population for a number of years after a census. which is the best...
Questions in other subjects:

Arts, 23.07.2019 10:30


Computers and Technology, 23.07.2019 10:30

Mathematics, 23.07.2019 10:30


