
Mathematics, 08.11.2019 04:31 donbright100
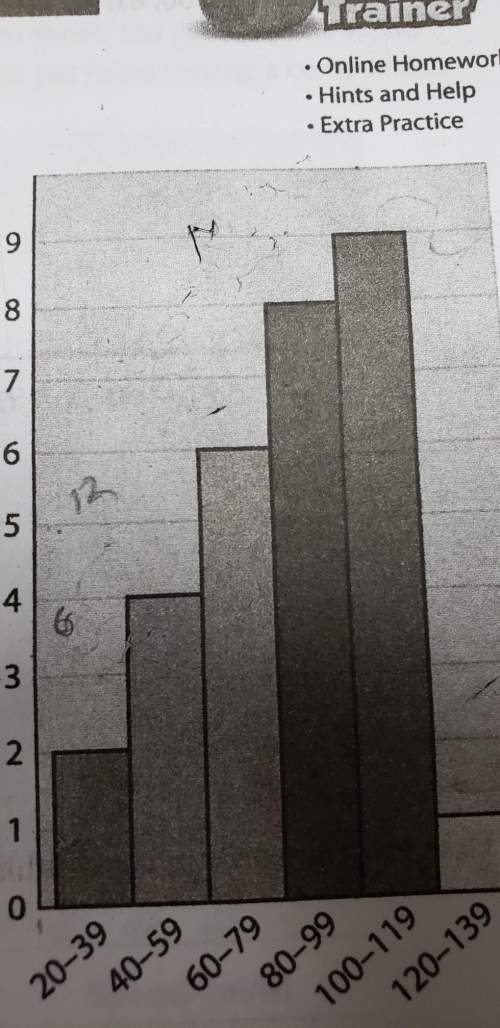
The graph shows the relationship between the total cost and the number of gift cards that raj bought for raffle prizes.
a graph titled cost of gift cards. the x-axis shows the number of gift cards, numbered 1 to 9, and the y-axis shows the total cost in dollars, numbered 10 to 90. blue diamonds appear at points (1, 20), (2, 40), (3, 60), (4, 80).
what would be the cost for 5 of the gift cards?
for each new desk that is purchased, by how much does the amount of money left in the school’s desk fund decrease?

Answers: 1


Other questions on the subject: Mathematics
Mathematics, 21.06.2019 14:00, chriscol4082
Aportion of a line bounded by two points is defined as
Answers: 1
Mathematics, 21.06.2019 17:00, saltytaetae
The tuition costs, c, for a local community college are modeled by c(h) = 250 + 200h, where h represents the number of credit hours taken. the local state university has tuition costs, s, modeled by the function s(h) = 300 + 180h. how many credit hours will a student have to take for the two tuition costs to be equal? round the answer to the nearest tenth of an hour.
Answers: 3
You know the right answer?
The graph shows the relationship between the total cost and the number of gift cards that raj bought...
Questions in other subjects:

Mathematics, 03.02.2020 07:58

History, 03.02.2020 07:58
Mathematics, 03.02.2020 07:58


