
Mathematics, 04.11.2019 19:31 elian1418
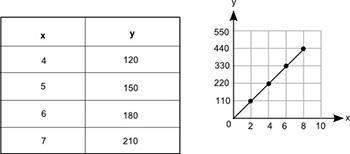
The table and the graph below each show a different relationship between the same two variables, x and y
how much more would the value of y be on the graph than its value in the table when x = 12?
150
300
450
600

Answers: 2


Other questions on the subject: Mathematics
Mathematics, 21.06.2019 18:30, jamalnellum56
The square pyramid has a volume of 441 cubic inches. what is the value of x? 1/7x is the height x is the base
Answers: 2
Mathematics, 21.06.2019 23:30, adriandehoyos1p3hpwc
Write the percent as a fraction or mixed number in simplest form. 0.8%
Answers: 2
Mathematics, 21.06.2019 23:30, freesiareal2780
What are the measures of angles a, b, and c? show your work and explain your answers. 25 points
Answers: 1
Mathematics, 22.06.2019 00:30, kelseeygee
What is the value of the discrimination for the quadratic equation 0=×2+2+×2
Answers: 2
You know the right answer?
The table and the graph below each show a different relationship between the same two variables, x a...
Questions in other subjects:

Biology, 04.09.2020 22:01
Mathematics, 04.09.2020 22:01


Health, 04.09.2020 22:01
Mathematics, 04.09.2020 22:01
Mathematics, 04.09.2020 22:01


