
Mathematics, 30.10.2019 18:31 strawberrymrmr3432
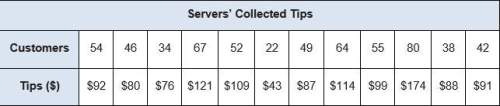
A) create a data plot displaying the data in the table. be sure to include a linear trend line(just right it on graph paper)
b) find the equation of the trend line (line best of fit). show your work.
c) predict the amount of tips that would be collected if 100 customers were served at the restaurant on a given day. explain your reasoning
d) explain how to use the regression calculator to make a reasonable prediction a data table.

Answers: 1


Other questions on the subject: Mathematics
Mathematics, 21.06.2019 16:00, aidengalvin20
Plz i beg u asap ! what is the equation of this graphed line? enter your answer in slope-intercept form in the box.
Answers: 2
Mathematics, 21.06.2019 18:00, cici170
Each month, a shopkeeper spends 5x + 14 dollars on rent and electricity. if he spends 3x−5 dollars on rent, how much does he spend on electricity? for which value(s) of x is the amount the shopkeeper spends on electricity less than $100? explain how you found the value(s).
Answers: 2
Mathematics, 21.06.2019 20:30, celestesanchezts
8. kelly wants to buy a magazine that is $25. later the magazine was marked up an additional 20%. what is the new price?
Answers: 1
You know the right answer?
A) create a data plot displaying the data in the table. be sure to include a linear trend line(just...
Questions in other subjects:
Mathematics, 02.07.2019 09:10

Chemistry, 02.07.2019 09:10


Biology, 02.07.2019 09:10


