
Mathematics, 30.10.2019 05:31 genesist720
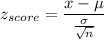
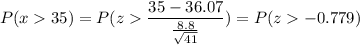
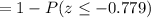
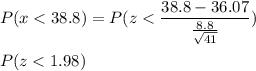
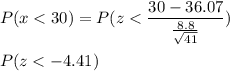
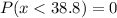
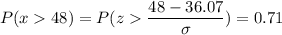
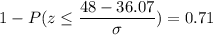
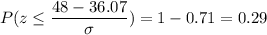
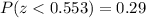
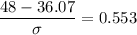
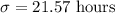
According to nielsen media research, the average number of hours of tv viewing by adults (18 and over) per week in the united states is 36.07 hours. suppose the standard deviation is 8.8 hours and a random sample of 41 adults is taken. appendix a statistical tables a. what is the probability that the sample average is more than 35 hours? b. what is the probability that the sample average is less than 38.8 hours? c. what is the probability that the sample average is less than 30 hours? if the sample average actually is less than 40 hours, what would it mean in terms of the nielsen media research figures? d. suppose the population standard deviation is unknown. if 71% of all sample means are greater than 48 hours and the population mean is still 36.07 hours, what is the value of the population standard deviation?

Answers: 1


Other questions on the subject: Mathematics
Mathematics, 21.06.2019 20:00, nauticatyson9
If private savings 'v' = 0.75s and total savings 's' equals $4.20 billion, solve for public and private savings.
Answers: 2
Mathematics, 21.06.2019 21:00, desirekotta20
An account with a $250 balance accrues 2% annually. if no deposits or withdrawals are made, which graph can be used to determine approximately how many years will it take for the balance to be $282? it's e2020 ni️️as
Answers: 1
Mathematics, 21.06.2019 21:30, cdvazquez727
The box plots show the average speeds, in miles per hour, for the race cars in two different races. which correctly describes the consistency of the speeds of the cars in the two races?
Answers: 3
You know the right answer?
According to nielsen media research, the average number of hours of tv viewing by adults (18 and ove...
Questions in other subjects:

Chemistry, 17.11.2020 21:10
Mathematics, 17.11.2020 21:10
Mathematics, 17.11.2020 21:10
Mathematics, 17.11.2020 21:10


Arts, 17.11.2020 21:10


