
Mathematics, 05.11.2019 15:31 andrecoral105
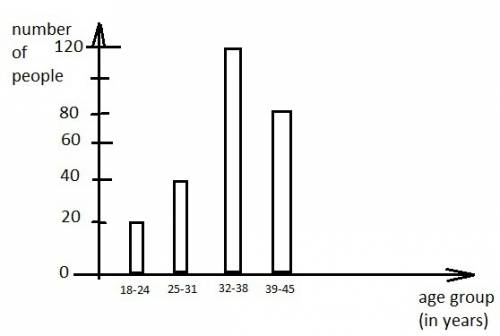
An event manager recorded the number of people in different age groups that attended a music concert.
a histogram titled concert audience is shown. the horizontal axis is labeled age group in years with bins 18 to 24, 25 to 31, 32 to 38, and 39 to 45. the vertical axis labeled number of people with values from 0 to 120 at intervals of 20. the first bin goes to 20, the second goes to 40, the third goes to 120, and the last goes to 80.
which data table accurately represents the data in the histogram?
age group number of people
18–24 80
25–31 120
32–38 40
39–45 20
age group number of people
18–24 20
25–31 60
32–38 180
39–45 260
age group number of people
18–24 20
25–31 40
32–38 120
39–45 80
age group number of people
18–24 260
25–31 180
32–38 60
39–45 20

Answers: 3


Other questions on the subject: Mathematics
Mathematics, 21.06.2019 21:50, quennnshyan7276
Which graph depicts the path of a projectile
Answers: 1
Mathematics, 21.06.2019 23:00, BaileyElizabethRay
Find the distance between c and d on the number line c=3 and d=11
Answers: 1
You know the right answer?
An event manager recorded the number of people in different age groups that attended a music concert...
Questions in other subjects:

Social Studies, 17.03.2021 23:50
Mathematics, 17.03.2021 23:50
Mathematics, 17.03.2021 23:50
Mathematics, 17.03.2021 23:50

Business, 17.03.2021 23:50


