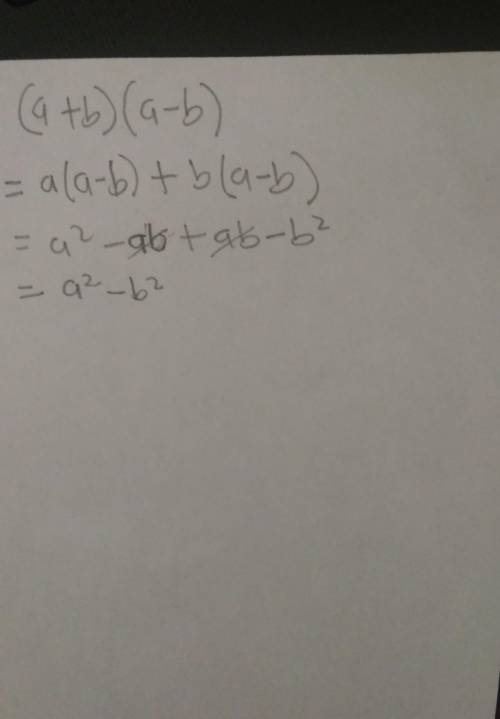
Write an algebraic proof showing that (a+b)(a-b)=a^2-b^2
for any a and b. (do not just plug in...

Mathematics, 29.10.2019 22:31 628397
Write an algebraic proof showing that (a+b)(a-b)=a^2-b^2
for any a and b. (do not just plug in a bunch of numbers and call it good.)
for those of you who need a bit of a refresher about what a proof is, to do this, you will be showing every little algebra step needed to start with the expression (a+b)(a-b) and, by just changing one thing at a time using valid algebra steps in a well-organized way, end up with the expression a^2-b^2. you will need to give a reason why each step works. (reasons would be things like "distributive property of addition over multiplication","a x a =a^2 by the definition of an exponent". if you're not sure of the fancy math words why, try to give the best student-words reasons you can.) reasons should be centered around why you can do something rather than just using words to narrate your steps!
you can write a two-column proof, a paragraph proof, or a flowchart proof. if you're not sure what to, try to figure out the algebra steps first and then figure out why you're allowed to do those.
hint: the distributive property would be an excellent place to start!

Answers: 2


Other questions on the subject: Mathematics
Mathematics, 21.06.2019 15:50, uehlingt39
Which of the following represents a number squared is equal to twenty more than nine times that number ? a) x squared = 9x + 20 b) x squared = 20x + 9 c) x squared > 9 + 20x d) x squared = 9 + x + 20
Answers: 2
Mathematics, 21.06.2019 16:30, dominickstrickland
The spring the owner of a sporting good store decreases the price of winter gloves from $10 to $8 each increases the price of swimming goggles from $8 to $10 without doing the math you think the percent decrease in the price of the gloves the same as the percent increase of the goggles explain why or why not
Answers: 1
Mathematics, 21.06.2019 17:00, alannismichelle9
The following graph shows the consumer price index (cpi) for a fictional country from 1970 to 1980? a.) 1976 - 1978b.) 1972 - 1974c.) 1974 - 1976d.) 1978 - 1980
Answers: 1
Mathematics, 21.06.2019 20:00, gordon57
Someone answer asap for ! max recorded the heights of 500 male humans. he found that the heights were normally distributed around a mean of 177 centimeters. which statements about max’s data must be true? a. the median of max’s data is 250 b. more than half of the data points max recorded were 177 centimeters. c. a data point chosen at random is as likely to be above the mean as it is to be below the mean. d. every height within three standard deviations of the mean is equally likely to be chosen if a data point is selected at random.
Answers: 1
You know the right answer?
Questions in other subjects:


English, 24.11.2021 09:40
Mathematics, 24.11.2021 09:40


History, 24.11.2021 09:40
Mathematics, 24.11.2021 09:50


