
Mathematics, 28.10.2019 06:31 megamegs80
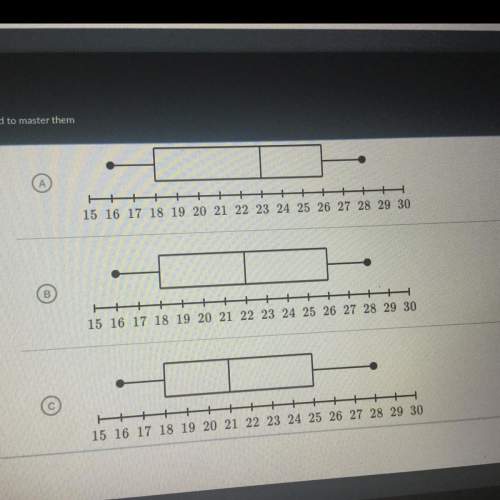
The data below represents the number of pages each student in anhwin’s class read during reading time. 16,16,16,20,21,21,23,25,26,26,28,28 . which box plot correctly summarizes the data? the image i attached are the answer choices! (a, b,c? ) hope you guys can !

Answers: 3


Other questions on the subject: Mathematics
Mathematics, 21.06.2019 12:30, trapqueenriz12
Arunning track in the shape of an oval is shown. the ends of the track form semicircles. a running track is shown. the left and right edges of the track are identical curves. the top and bottom edges of the track are straight lines. the track has width 56 m and length of one straight edge 130 m. what is the perimeter of the inside of the track? (π = 3.14) 260.00 m 347.92 m 372.00 m 435.84 m
Answers: 1
Mathematics, 21.06.2019 20:00, arianaaldaz062002
If the simple annual interest rate on a loan is 6, what is the interest rate in percentage per month?
Answers: 1
You know the right answer?
The data below represents the number of pages each student in anhwin’s class read during reading tim...
Questions in other subjects:

Physics, 08.01.2020 03:31
Mathematics, 08.01.2020 03:31


Chemistry, 08.01.2020 03:31


Mathematics, 08.01.2020 03:31


