

The table shows a limear function.
a. determine the difference of outputs of any two inp...

Mathematics, 23.10.2019 07:50 youtubeviewer109
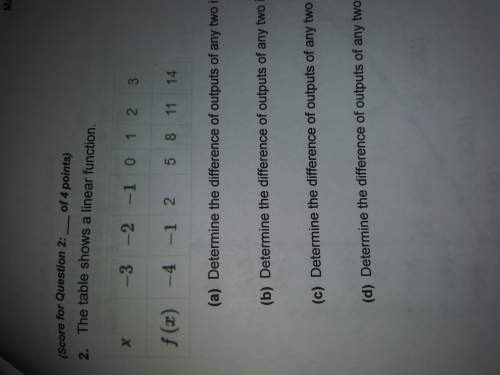
The table shows a limear function.
a. determine the difference of outputs of any two inputs that are 1 unit apart. show your work
b. determine the difference of outputs of any two inputs that are 2 units apart. show your work
c. determine the difference of outputs of any two inputs that are 3 units apart. show your work
d. determine the difference of outputs of any two inputs that are
4 units apart. show your work

Answers: 2


Other questions on the subject: Mathematics
Mathematics, 21.06.2019 16:20, mattmaddox86
The number of potato chips in a bag is normally distributed with a mean of 71 and a standard deviation of 2. approximately what percent of bags contain between 69 and 73 potato chips? approximately 68% approximately 71% approximately 95% approximately 99.7%
Answers: 2
Mathematics, 21.06.2019 20:30, becca2327
Tom is the deli manager at a grocery store. he needs to schedule employee to staff the deli department for no more that 260 person-hours per week. tom has one part-time employee who works 20 person-hours per week. each full-time employee works 40 person-hours per week. write and inequality to determine n, the number of full-time employees tom may schedule, so that his employees work on more than 260 person-hours per week. graph the solution set to this inequality.
Answers: 2
You know the right answer?
Questions in other subjects:


Mathematics, 31.08.2021 04:00
English, 31.08.2021 04:00

Mathematics, 31.08.2021 04:00


